


Big data. It has always been a “someday” thing for me to learn about - machine learning, AI, analysis. As interesting as it seems and as much as I love to slice and dice data in SQL Server, for example, I've not yet managed to move to this next horizon. It's always felt like something for rocket scientists, even though Microsoft and others have worked hard for years to make it accessible through education and ever-improving tools and services. I imagine that there are many developers, like me, interested and absolutely qualified, yet somehow still daunted by big data.
Recently I saw a demo of Azure Data Explorer (ADX), a service that enables you to blend huge amounts of data from various data sources and perform analysis on it, even in real time with streamed data. And like many of Azure's services, it's fast and can auto-scale as needed. My curiosity was piqued yet again, so I have explored the explorer to understand it better and to get a feel for what it's like to work with.
Azure Data Explorer provides a way to connect a variety of data sources and then perform analysis on their data. The data sources don't need to be homogenous. In other words, you can combine relational data, non-relational data, text files, and more. Connecting to various data sources is simplified using intelligent importing tools and connectors. Azure Data Explorer also integrates with other services, such as Power BI, to visualize results.
The focus is on handling huge amounts of data. For example, if you're collecting logs or telemetry data in your systems or via IoT, Azure Data Explorer is a great tool for dissecting that data. At the fall 2020 Azure Data Explorer online event (https://bit.ly/adeoct2020), CIOs and others from various businesses shared how they were using Azure Data Explorer to solve problems that have a major impact on their business. One that really resonated with me was from Daimler Trucks North America. They've been collecting telemetry data for a long time but weren't really getting much value from it. Azure Data Explorer has enabled them to easily combine data from myriad IoT devices in their trucks with data from their factory and elsewhere, and perform analysis which now allows them to anticipate mechanical problems and be ready to handle them quickly.
Key Components of Azure Data Explorer
At a very high level, there are two components to Azure Data Explorer: One is data management, which is responsible for ingesting data in high scale and a powerful engine for arranging and interacting with that data. These are paired with the other Azure Data Explorer component in an Azure Data Explorer cluster. Once you've created a cluster, defining the compute power and a database, you can then identify data sources to be managed by the database. You can configure any number of ways to access that data, whether you are ingesting it into your database or simply connecting to an external source as needed.
The two main paths for ingesting data are batch ingestion (for pulling in large amounts of data) and streaming, which can be used to frequently and rapidly pull in small amounts of ever changing data that can be nearly real time. There are so many ways you can ingest data whether using Azure Data Explore in the Azure portal or an API. The sources can vary widely from a text file on your computer to files in Azure Blob storage or data in many Azure services such as Event Hub, Event Grid, and IoT Hub.
With the data available in the database, it's then time to perform analysis and this is done with a proprietary query language named Kusto Query Language (KQL). Kusto was the original code name for Azure Data Explorer - a nod to the famous ocean explorer, filmmaker, researcher, and more, Jacques Cousteau. That's because Azure Data Explorer aims to “explore an ocean of data.” I grew up watching “The Undersea World of Jacques Cousteau” television series, so I just love this tidbit.
As with almost any Azure service, you can do your work in the Azure Portal, at the command line via REST APIs or SDKs for a variety of platforms such as .NET, Java, Node, GO, PowerShell, and others.
For this first dive (pun not intended, but I'm just leaving it here anyway), I'll use the Azure Portal and walk you through a simple workflow. It's important to understand that Azure Data Explorer clusters are not covered by the Azure free services and can rapidly eat into your monthly credit from a Visual Studio subscription. Therefore, I'll show you how to set up a cluster with a database and even ingest some data, but then I'll flip over to a sample cluster that Microsoft provides to experiment with Kusto Query Language. That way, you won't incur processing fees. At the end, I'll remind you to delete any test cluster or database that you created.
Creating a Cluster and Database in the Azure Portal
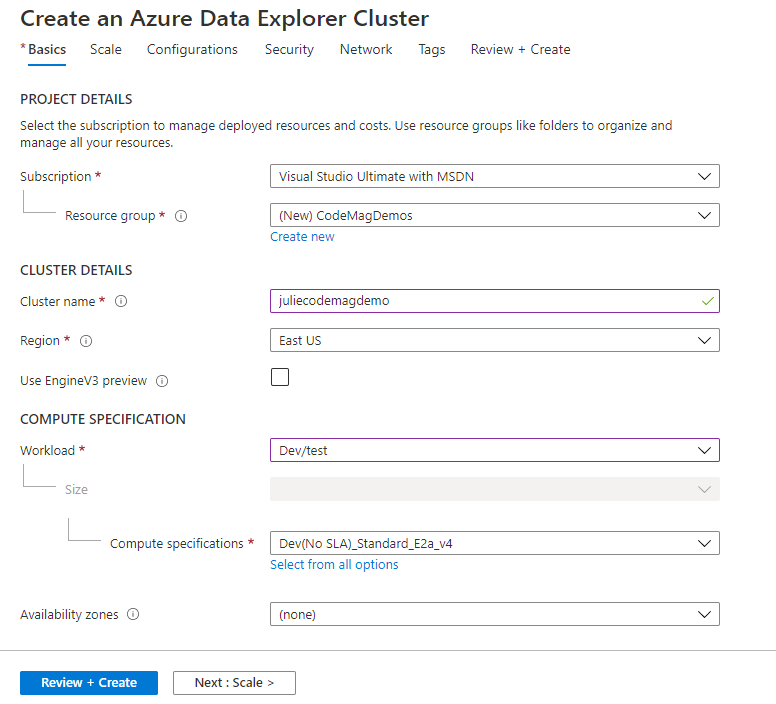
In the portal home, the big plus sign to create a new resource is the easiest place to start. From there, search on “Azure Data Explorer,” click on the one and only result, and then click the Create button on the next page. Because you're just creating a basic cluster, you only need to fill out the first page, Basics (Figure 1). Here, you'll provide your subscription, an existing or new resource group, a name for the cluster (all lower case and must be unique), and specify in which region this cluster should live. Be sure for this test to choose the least costly workload, Dev/test, under Compute Specification. There's no need to specify an availability zone. And you can skip all the other pages and go directly to the Review + Create page where you can then click the Create button at the bottom.
The cluster gets created very quickly, but then it takes about 10 minutes to deploy, at which point, you'll see a “Go to resource” button to bring you to the page for managing the cluster.
Create a Database in the Cluster
On the cluster management page, there are a number of paths to create a database. I'll use the + Add Database link at the top. I'll specify MyFirstDatabase as the very creative database name. The default retention for the database is 3650 days, i.e., 10 years. You might want to lower that. The cache period is for what's referred to as a “hot cache.” This is an additional cache for your data that's stored on SSD drives for fast queries. Just leave the default at 31 days because you'll be deleting this shortly anyway. The database only takes a few seconds to be created and then it's ready.
Before ingesting any data, you can get your first look at Kusto and the actual Data Explorer. In the cluster view menu on the left, select the Query option that opens up the explorer. On the left, there's a list of your clusters (just the one so far) and you can expand that to see your databases and further when you have more objects in there. On the right, there's the query panel and below that, the results. Kusto is a combination of expressions and commands. Commands begin with a period. The query panel does have IntelliSense built in and I was really impressed with how intelligent it is. In fact, I found the entire “fit and finish” of the explorer to be outstanding. It's hard to believe it's a Web app, although given my experience with Electron apps like Visual Studio Code, perhaps I shouldn't be so surprised. Either way, kudos to the devs behind the UX of the explorer.
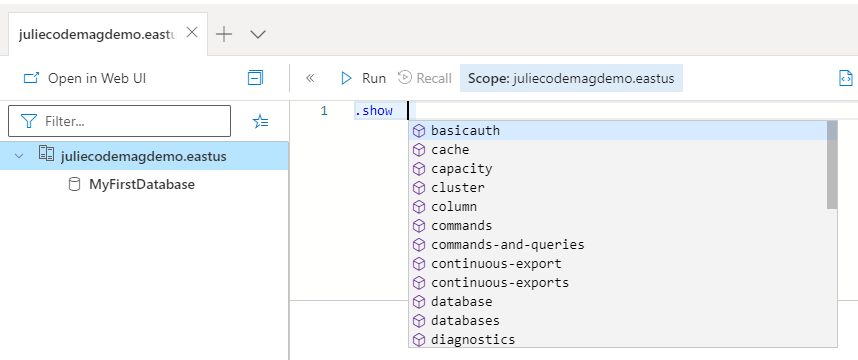
In the query panel, type .show. Show is a command to get a list of objects and IntelliSense displays all of the types of objects you can show (Figure 2). The command is relevant to the scope of what's highlighted, in this case the cluster.
If I show databases (and then choose Run), the result screen below the query displays a table with each database and some details. You can expand the row and see a JSON representation of the table. Kusto uses JSON to describe objects whether you're reading them or writing them. You'll see more about this shortly.
Ingesting Data into a New Table
There are many paths to ingesting data. I'm going to ingest data that I've stored in my Azure Blob Storage. I don't expect you to perform these steps with me if you're following along, because you'll get a chance to do some hands-on with the free sample cluster shortly. It's an interesting process, and I want to remind you that although I'm using the portal to hand-hold me through this, you do have the other options, e.g., the CLI, SDKs, or REST API to perform any of these functions.
While on the cluster's Overview page, if you scroll down to the section that says “Welcome to Azure Data Explorer,” you'll see that Step 1 - Cluster creation and Step 2 - Database Creation are marked complete with their little green checkmarks. Step 3 invites you to either “Ingest new data” into a new table in your database or “Create data connection,” which uses a connector (Event Hub, Blob storage, or IoT Hub). Select the “Ingest new data” option, which will lead you to what's called “One-click ingestion.”
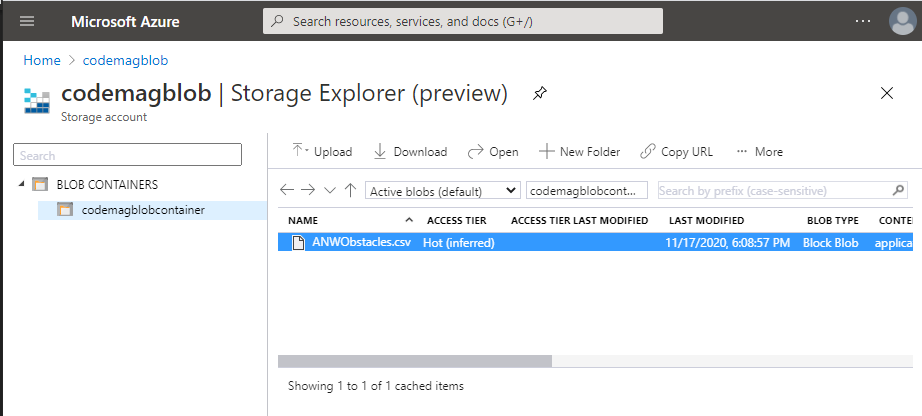
Here, you'll need to identify the database and a table (choose Create new for the table) and then the source type. If you choose “From file” as the Source type, you'll be guided to upload a file. You can also choose from blob, blob container, or Azure Data Lake Storage. I have a file that I gleaned from data.world (https://data.world/ninja/anw-obstacle-history) containing a list of obstacles from the reality TV show, American Ninja Warrior. It's not really “big data” at 825 rows, but it's big enough for me to learn with. My file is a CSV file, ANWObstacles.csv, which I imported into Azure Blob Storage (Figure 3). One-click ingestion makes it easy to pull it from there into my database.
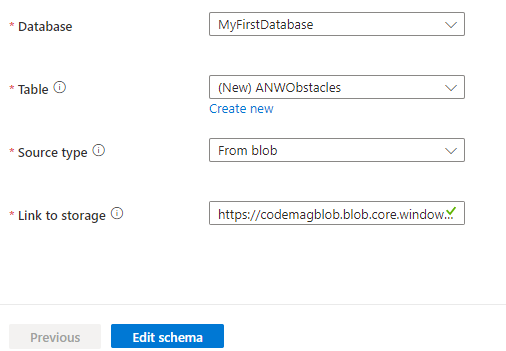
I've chosen “From blob” as my source type, which triggers the form to ask me for a link to the blob storage (Figure 4). Although the entry is not full displayed in the screenshot, it's composed, in fact, from two pieces of information from the file's properties in the Storage Explorer. First is the URI of the file, followed by a semi-colon, and then its access key.
I found editing the schema interesting because it lets you see some more Kusto as well….which you could use directly in the explorer (or any of the other options) rather than depending on the portal walkthrough as I'm doing now.
If you have ever imported data into SQL Server, this may feel familiar, as it did to me. The schema view shows a sampling of the data and its best guess for column names. In my case, it came up with Column1, Column2, etc. even though my CSV file's column names are visible as the first row of data. You can indicate that the column names are included (via a checkbox on this page), in order to remove that first row of data. This should cause the table column names to adopt the incoming data column names. You can edit a column name by double-clicking on it in the table header and typing in a new name. You can also drag the columns around as you like.
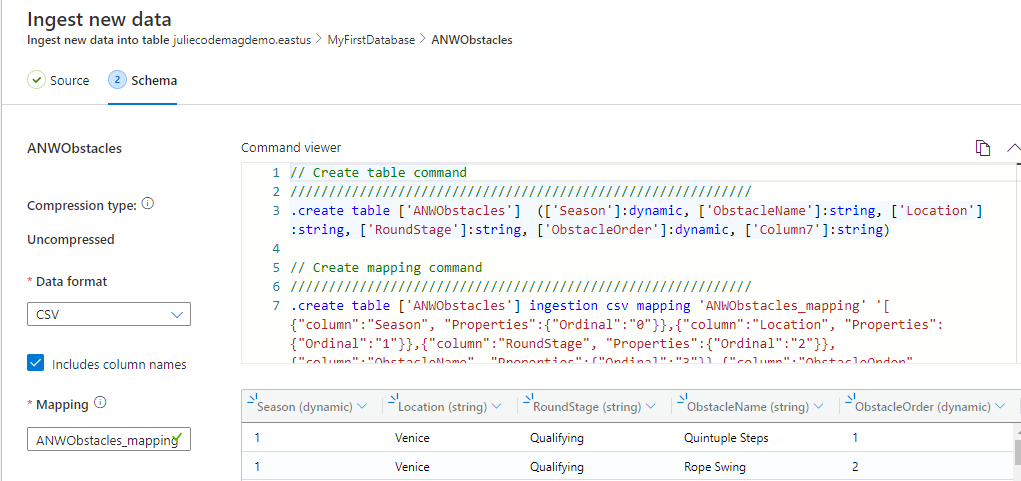
In the top right corner above the grid, there's a drop-down arrow. Click that, and the KQL for creating and mapping the table (i.e., aligning the fields or properties of the incoming data to the columns of the table) is displayed (Figure 5). There are two steps displayed. The first is a simple .create table command and the second creates the mappings for the table. I liked seeing that because it helps me learn some more Kusto basics.
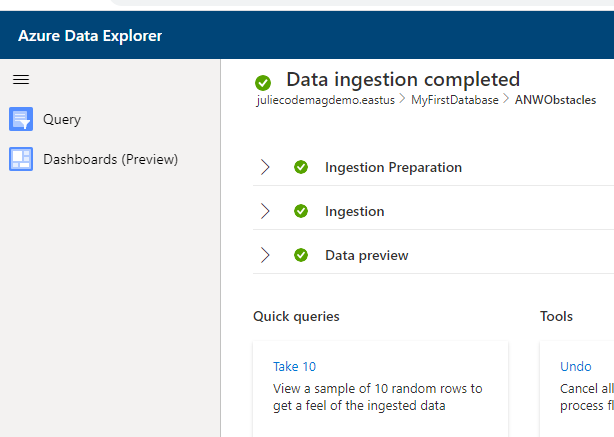
Now I'll start the ingestion with a click of the Start ingestion button. Because it's a small file, the ingestion was finished in a matter of seconds.
The final page (Figure 6) also provides some quick queries you can try out. We'll look a bit further at what I've just ingested and then switch over to Microsoft's sample cluster to work some more without worry about the impact on your Azure account. Notice that the final page is also showing in the Azure Data Explorer, not the management window for the cluster.
Querying in the ADX Web UI
Click on the Take 10 query. This opens a new browser tab with your cluster in the Azure Data Explorer UI. Queries are different from commands. First, you identify the data source to query and then the operations to perform. You can even define a data source on the fly. There are so many operators in Kusto! I hope you'll be inspired to start exploring them after reading this article. The statement structure begins with the data source to be queried. You can combine one or more query operators with each operation preceded by a vertical pipe. The query built by the Take 10 option starts with the ANWObstacles table as the data source and then a pipe to delineate a new operator, take, followed by the number of rows to take: 10.
[?ANWObstacles']| take 10
Below the query editor is a table of the resulting rows along with details about the query, for example, that it took .194 seconds. Like the earlier results, you can expand any row to see a JSON view of its data.
Now I'll flip over to the public sample so that you can follow along with some of the querying without concern about incurring time on your Azure account.
The shortcut to get to this cluster in Azure Data Explorer is Aka.ms/ADXTry. You'll still need to use an Azure account to access this so you'll be asked to log in. In fact, when you log in, if you created any clusters in your account, you'll see them as well. All of the clusters your account has access to will be displayed in the explorer. The sample cluster is named “help” and the database is named “Samples”. Within there, you'll find assets created for this database, some custom functions, views, tables, and a link to an external table.
Let's look first at the tables in the tables folder. There are five subfolders, each containing one or more tables. These subfolders are an option you can use when creating a table with the .create table command. The StormEvents table in the Storm_Events folders was ingested from a CSV file in blob storage just like I did with my ANWObstacles table. The data originates from noaa.gov public data.
In the query window, you can target that table and then run queries against it, just as I did above. However, you don't need to use the braces and quotes around the table. Let's try out the count operator.
StormEvents | count
The results pane almost instantly relays that there are 59,066 rows in the table.
The KQL language is very rich and well documented. But for really digging in, I'll point you to the documentation at https://docs.microsoft.com/en-us/azure/data-explorer/kusto/concepts/.
I'm going to stick to some of the most basics like sorting, filtering, and projections just so you can see what this looks like. Let's just look at the structure using a few rows from StormEvents.
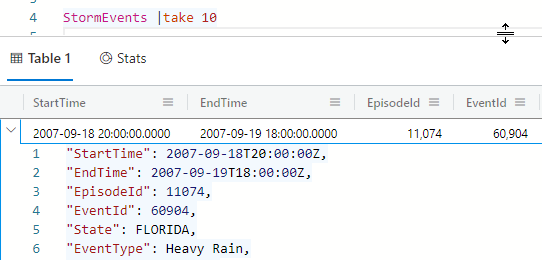
As long as you have the pipes in your query, formatting isn't required. “StormEvents | take 10” works just as well without any line wrapping but the IDE is happy to format a selection or an entire document for you.
There are about 15 columns in the table. Figure 7 shows a view where I've expanded the first row to expose some of the JSON of that record.
Expanding Your KQL Chops
One thing I like about Kusto is that within the explorer, the syntax is very discoverable. Granted, I've been writing SQL for many years, so I have some notion of what to expect from a query language. But I came up with the following query, including the calculations and field naming just using IntelliSense and a guess at what the various functions I wanted might be. This query calculates the length of a storm using the available properties and then I found a startofday function that returns the zero hour (midnight) of a date.
StormEvents | project Length=EndTime - StartTime, StartDate=startofday(StartTime), State,
EventType | sort by StartDate | take 100
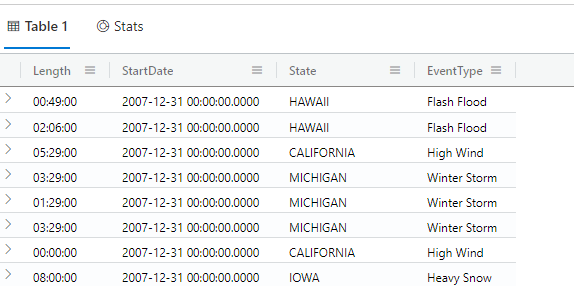
Figure 8 shows a selection of the query results.
Note that in the above query, I was forced to wrap the lines in order to fit them into the CODE Magazine (print) format. However, this will still work in the Web UI query window. The process is not reliant on formatting so long as the pipes are there.
I realized that I prefer to sort by the true StartTime. But if I left the sort tabulation after the projection, StartTime would become unavailable, so I moved the sort before the projection. This, to me, is a great example of how differently (and perhaps more logically) KQL works than SQL. The operations are performed in the order in which they appear. Additionally, I discovered the scalar function format_datetime in the docs so was able to format the StartDate to be more readable.
My final query looks like:
StormEvents | project Length=EndTime - StartTime, StartDate=format_datetime(startofday(StartTime),'M/d/yyyy') State,
   EventType | sort by StartDate | take 100
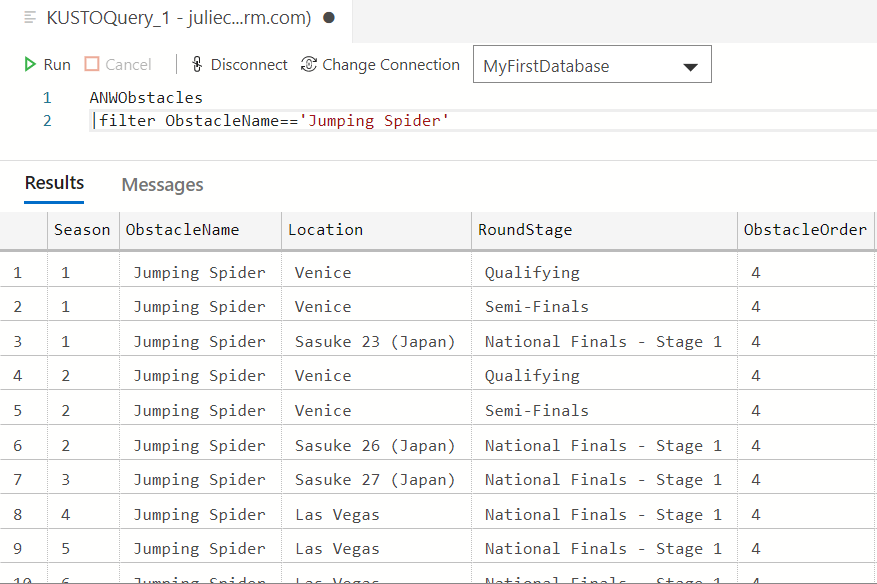
After some more exploring, I was amused to explore storm events in my home state of Vermont with results heavy on events of high winds as I listened to the wind roar outside my home while typing this sentence.
StormEvents | filter State=='VERMONT' | sort by StartTime desc | project Length=EndTime-StartTime,
   StartDate=format_datetime(startofday(StartTime),'MM/d/yyyy'), Time=format_datetime(StartTime,'hh:mm tt'),
   State, EventType
At this point, I started seeing Kusto as closer to a programming language than a query language. Little things like the double equals sign in the filter moved my perception. And then I found it even more interesting to filter further into an area with a radius of 30KM from my town using the following operator and function:
| filter geo_point_in_circle(BeginLat, BeginLon, 44.33, -72.98, 30000)
So far, I've been working over familiar territory but remember, Kusto is for big data. There are entire sets of functions, for example, to perform time series, machine learning, and more cool geo functions like the one I just used. There are commands for querying across clusters and aggregating data. There's so much to take advantage of and surely someone who's already doing this type of analysis will be much more creative in test driving the capabilities.
Earlier I mentioned that you can incorporate Azure Data Explorer with services such as Business Intelligence to visualize data. But there's data visualization built in as well. There's a handy operator called render with fourteen different visualization options! (https://docs.microsoft.com/en-us/azure/data-explorer/kusto/query/renderoperator?pivots=azuredataexplorer). The Web UI knows how to display the results. Or you can set up a dashboard to more beautifully present your cluster in an Azure Data Explorer Dashboard (https://docs.microsoft.com/en-us/azure/data-explorer/azure-data-explorer-dashboards ).
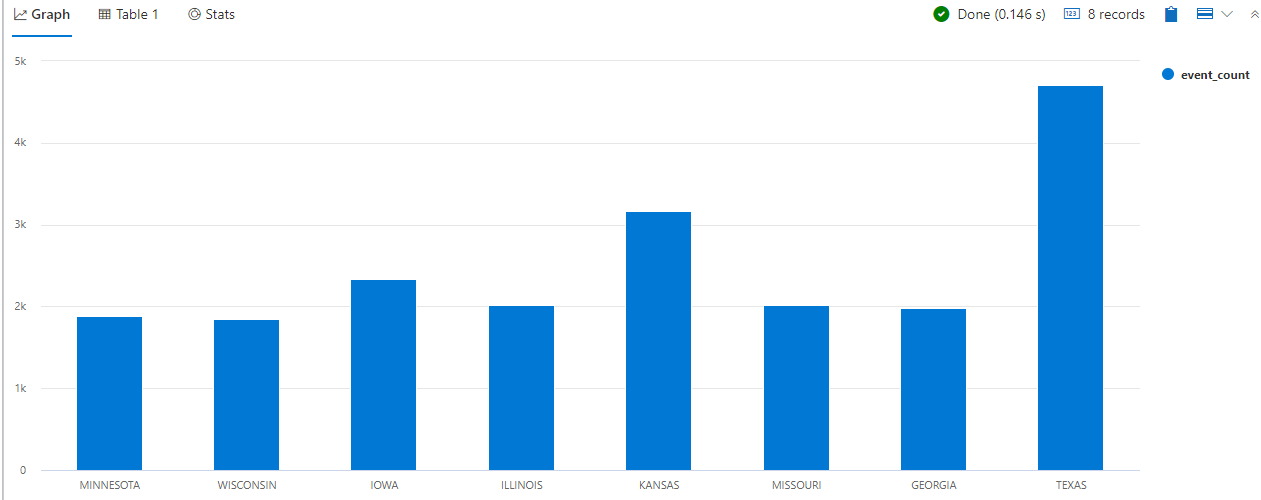
I'm going to lean on a nice little sample from the docs that analyzes states with high storm activity so you can see some more of the Web UI's visualization. And check out the summarize operator, which is similar to the familiar SQL GroupBy.
StormEvents | summarize event_count=count(), mid = avg(BeginLat) by State | sort by mid
   | where event_count > 1800 | project State,
   event_count | render columnchart
The query result window has a new tab called Graph showing the chart (Figure 9), but you can also view the data in a table if you want.
Another interesting thing you can do with the queries is comment out tabulations. For example, I wanted to see if Vermont would show up if I didn't limit the query to states with over 1800 events, so with slashes (more familiar C# style language elements here) I was able to comment out that particular operator in the query. Notice that the slashes are in front of the pipe.
StormEvents | summarize event_count=count(), mid = avg(BeginLat) by State | sort by mid //| where event_count > 1800
   | project State, event_count | render columnchart
Working with External Data
Let's take a look at that external table, TaxiRides. I mentioned earlier that an external table hasn't been ingested. Instead, the data source has been wired up to the cluster. Any analysis performed on it is live and may take some time to process. For example, I wanted to see how many records there were and so I ran a count query. Note that because the table is external, I needed to specify that in the KQL with external_table. The query therefore looks like this:
external_table("TaxiRides") | count
I knew in advance from an article (https://yonileibowitz.github.io/kusto.blog/blog-posts/analyzing-nyc-taxi-rides.html) by Yoni Leibowitz from the Azure Data Explorer team about using Kusto with the NYC Taxi Data that there were over two billion rows in this table. And because I'm using the sample cluster, I won't get hit with a surprise bill from Azure for mucking around with it. Either way, I was a little surprised at how long it took, but this is because nothing is cached. Kusto literally had to count every single record. After four minutes, it timed out with a network error. Which is understandable. The Leibowitz article ingested the data, which makes more sense for the hard-core analytics he was performing.
I tried something a little less taxing:
external_table("TaxiRides") | 5000
This query was complete in 1.694 seconds. That's seriously impressive because it pulled those records (each one with a little over 50 properties) on the fly from the external source.
A Quick Look at Azure Data Studio's Kusto Extension
After spending quite a bit of time playing around with the Azure Data Explorer's Web UI, I gave into my desire to try some of this in Azure Data Studio with the Kusto extension. I'm a big fan of Azure Data Studio and have written a number of articles about it over the past few years.
After logging into my Azure account, Kusto clusters was one of the sections showing in my account. I had to explicitly connect to my cluster and was then able to write KQL queries with IntelliSense help and see the results (Figure 10).
You can also work with the free sample cluster in the extension! Follow the connection steps in the extension's documentation at https://docs.microsoft.com/en-us/sql/azure-data-studio/extensions/kusto-extension?view=sql-server-ver15.
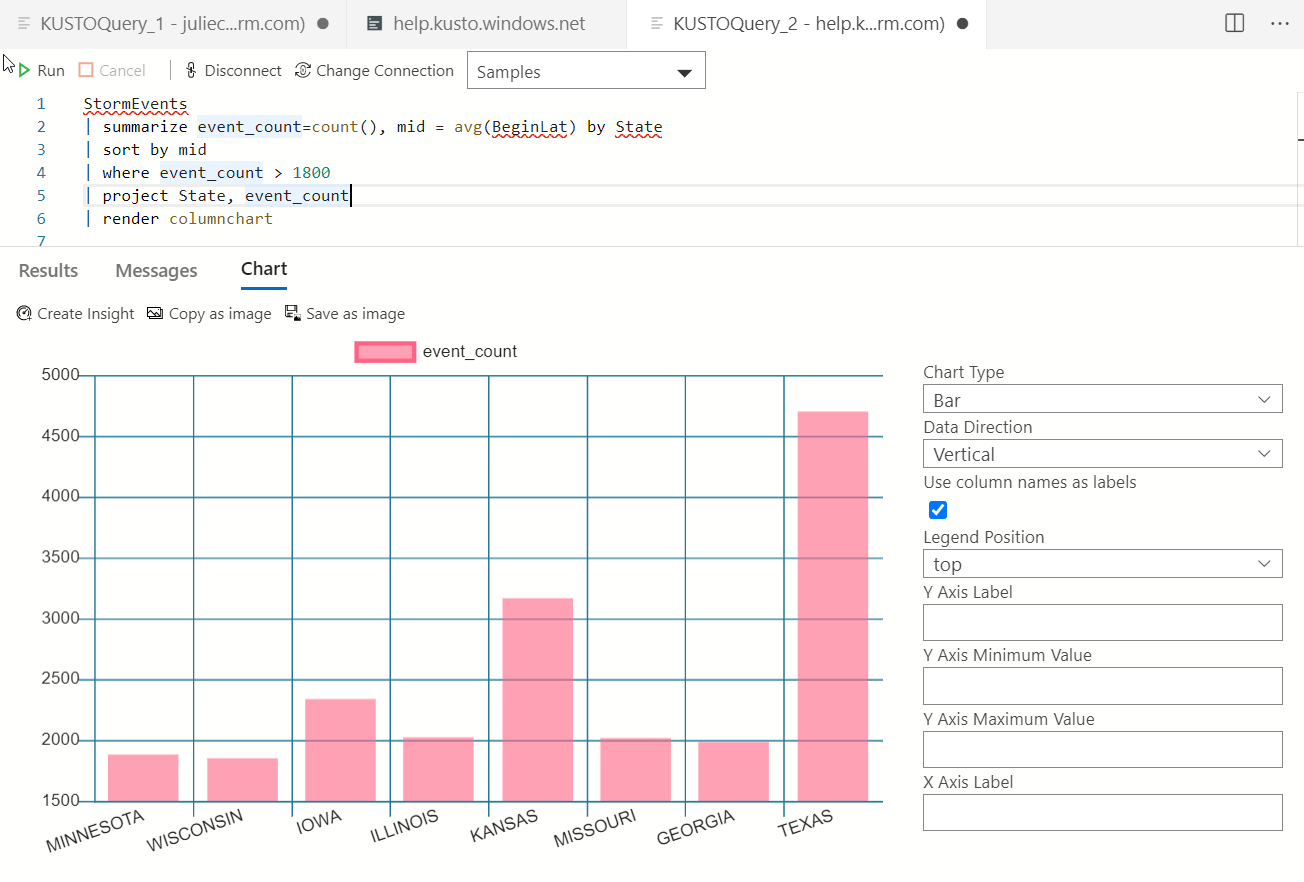
Once connected, I reran my final StormEvents query, which I rendered as a chart earlier. Azure Data Studio can't output the rendered chart, but ADS has its own charting feature for results. I was able to view the tabular results of the query as a chart with lots of options for rendering and formatting (Figure 11).
Now That You've Passed Kusto 101
I may not have a lot of experience with the needs of businesses that analyze huge amounts of data coming from myriad sources in order to make critical business decisions and solve problems. However, having read about how those businesses are able to use Kusto to perform this work and now exploring the very beginnings of its capabilities, I can only imagine the power it's putting in their hands. I've only done enough to get a feel for how things work and this very cool query language that feels more like a coding language, adding in the huge processing power and myriad features that allow for extremely sophisticated slicing and dicing. Perhaps what I need next is to take up residence as a fly on the wall at one of those companies that's using Kusto to solve important problems.
Finally, as promised, if you did follow along creating a cluster in your Azure account to experiment, don't forget to remove it when you are done exploring to avoid surprise charges to your account.