


Microsoft's Web Application Stress Tool provides an easy way to simulate large numbers of users against your Web application.
This tool makes it possible to make intelligent decisions about hardware and software load incurred by your application and how much traffic a given machine or group of machines can handle. In this article Rick shows how the tool works and how to properly interpret the performance data it generates.
Building Web applications has now become a fairly common scenario for developers building new applications or updating and Web enabling existing applications. As applications move to the Web into a server based environment it becomes increasingly important to be able to gauge the performance and load capability of an application. Developers must be able to answer hard questions about how much traffic a given site will be able to handle and make intelligent choices of hardware, software and often times even design approach of the application to make sure the application will be able to handle an onslaught of customers on the Web site. We should all be so lucky to have to worry about the problem of being too successful!
But it's often surprising to find how many Web sites hit their limits and catch the operators off guard. An overloaded Web site is a major problem and once happening the problem often can't be addressed rapidly. A quick fix typically involves adding additional hardware that must be purchased, installed and configured - a process that may take days or even weeks. Being prepared and understanding the limits of an application and managing advertising to bring traffic to a site in measured spurts is crucial to the success of large and even not so large commercial sites.
Additionally, it's important to understand that today's tools often make it much easier to build Web applications than the tools from even a year ago. Today we have powerful scripting engines, easy access to COM components we can write in high level languages and Web servers that self-configure for the most part. But along with the ease of use also comes more overhead and resource load on the server and it becomes even more important to look at load issues right from the start of application development. Load testing should be performed in the initial design phases to get a good idea what overhead the application components incur on the server. Constant monitoring should be performed as development continues on always keeping a close eye on how well the software platform in relation to the hardware it will be running on.
The problem is that often times these scalability questions such as ‘How much traffic can we handle on our particular hardware?’ are not easily answered because it's hard to measure performance of Web applications outside the actual environment that they will be running in. Even the process of testing Web applications seems daunting: There are so many pieces involved from a Web browser client, the Web server, the backend application and the backend database server. The bottom line is that the only way to realistically test the load capabilities of a Web application is in a close approximation of a live environment, which means actually ‘running’ the Web application.
Introducing the Web Application Stress Tool
So, how do we ‘run’ a Web application realistically? The answer is that you have to simulate many clients simultaneously hitting your site. To this end, Microsoft has released an easy to use, yet very powerful and flexible tool called the Web Application Stress tool (WAS), which provides this functionality in a freely downloadable application service.
WAS requires Windows NT or Windows 2000 as the tool runs as an NT Service. For realistic performance testing, it's also recommended that you run the stress testing tool from a separate machine other than the Web server. The actual request generator can be fairly resource intensive while generating the Web requests and this overhead can affect performance of the Web site under max loads. However, even though the documentation states two machines are a requirement you can certainly run WAS on the same machine as the Web server, but don't expect 100% accurate results especially when you're testing at the top end load for the hardware you're running on.
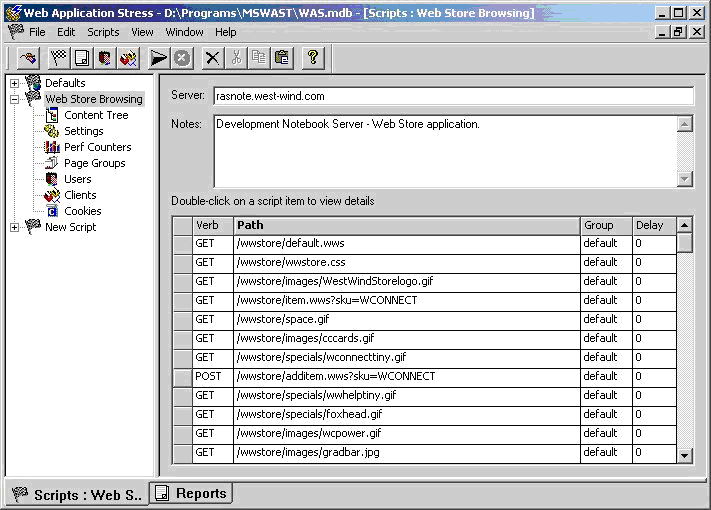
The user interface of WAS is straightforward with a list of scripts and sublists of the properties for the particular script on the left and a data view on the right. The data view depends on the selected script option. The most important views are the default view (see Figure 1) that shows you all selected links and the server you're testing and the Settings view, which configures how the links are executed against the server and at what load level. Other options allow you to configure users with usernames and passwords (optional) since you can simulate large numbers of clients this maybe necessary for sites secured with some level of authentication. You can even configure specific pre-existing Cookie values for each user if you have to. In short, there are a lot of options for most HTTP scenarios available, even though most of these are unlikely to be utilized in typical tests. It's there for you if you need the control to customize your tests.
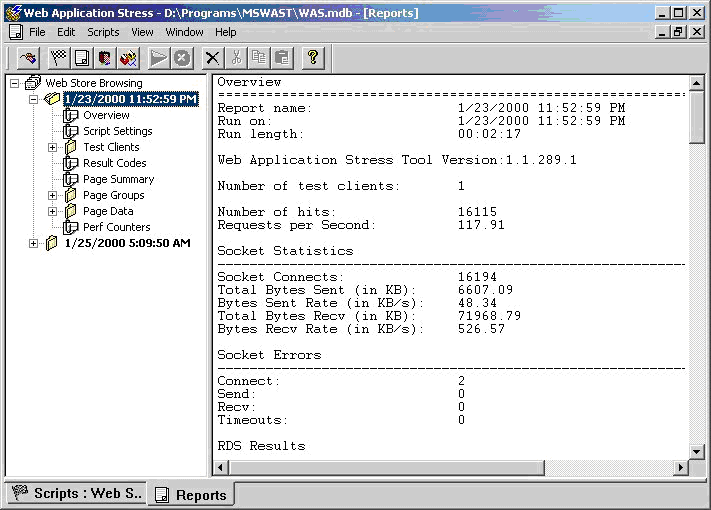
Once a test has been completed there's a report view where you can view the results of the test, which provides a thorough summary of the test just performed including information about total hits and hits per second as a whole, hits for individual pages, failures and response codes as well as bandwidth breakouts.
Getting started with WAS
The concept behind WAS is simple: You create a test script by capturing a browser session using Internet Explorer basically walking through your application, as a typical user would do. As you do this WAS captures the content of all these Web requests. WAS captures everything: Hyperlink clicks, Form submissions, Redirect links and Authentication info - everything needed to capture the user's session through your site.
Creating a script is very easy: You can use the Browser Recorder to capture a browser session and have WAS generate a test script from captured links. A manual mode is also available to allow you to manually add links and information about each link.
As you can see in Figure 3 there are a few options you can choose for the Browser Recorder: Capture delay, and record cookies and host headers. The delay between requests will result a more realistic test in terms of how people are actually navigating a site, giving you a more accurate picture of how users on a site map to connections on the Web server. If your goal is to find the limits of your site leave this option unchecked. If you want to simulate a specific user number scenario go ahead and capture the delay as it provides a more realistic view of the browsing scenario. I'll talk more about this delay when we look at the load options for the test.
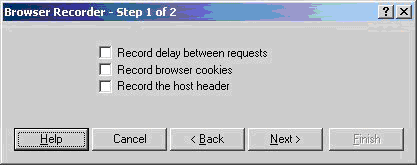
The Record browser cookies and Record host header options allow you to capture a specific user session, rather than dynamically tracking this information at the time of the request, the latter of which is how a typical browser would behave. Typically you'll want to leave those options unchecked to let the WAS client create cookies and host headers just like a user on your site would. However, if you have persistent state information for your site (such as a user profile or other info that is connected to a permanent cookie) make sure that you clear the cookie before you run your tests to simulate a new user coming to the site and going through the steps of configuring the required user state. For example, on my Web Store site users set up a user profile when they place an order. The profile is recovered when they return to the site and tracked with a Cookie. If I never went through and set up my profile information WAS would not be able to actually process an order because the profile information would be missing and not get filled out.
If you typically require users with an established cookie and profile then make sure that you do check the Capture browser cookie option.
When you click Next|Finish on the browser recorder you'll be whisked into IE and you're ready to capture requests in your browser. In my case I ran a test against my West Wind Web Store on my development machine starting with the home page and typing that link into the browser's address line. After that I'm off on my dev site and with WAS capturing links. This site happens to be Web store application that relies on Cookies to track users, handles profile information for customers and secure order processing via HTTPS. All of these things were beautifully captured by the WAS script I set up.
You want to be careful to create scripts that match closely to what people will be doing on your site for real. For example, I went to the home page, browsed around the various categories, looked at a few items, ordered a couple, then took one out. I then went in and examined and changed my user profile before going back to the shopping basket and going through the checkout process. In other words I wanted to make sure the majority of the application gets exercised in a somewhat realistic manner. When I'm done I can switch back to the running WAS application in the background and click on the Stop Recording button (Figure 4).
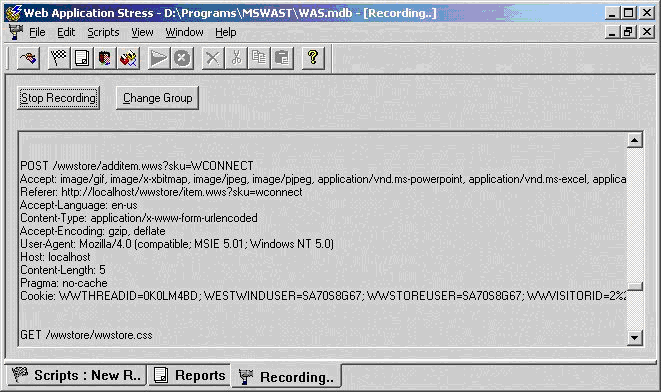
If you look closely at the WAS form before clicking the Stop Recording button you'll see how WAS is capturing the browsers progress. The data is captured and stored in an Access (MDB) database file including any content captured from form variables. You can also review the captured data for each link in the Default View (Figure 1) by double-clicking on the grid area next to the request. A dialog lets you edit the querystring, POST data and security info.
Once you've captured the script you now see a view like the one shown in Figure 1 with your capture Web links shown on the right in the data view of the main WAS window. With the links captured your next step is to configure the load options for running the script. You do this using the Settings option in the list and you'll see a dialog as shown in Figure 5.
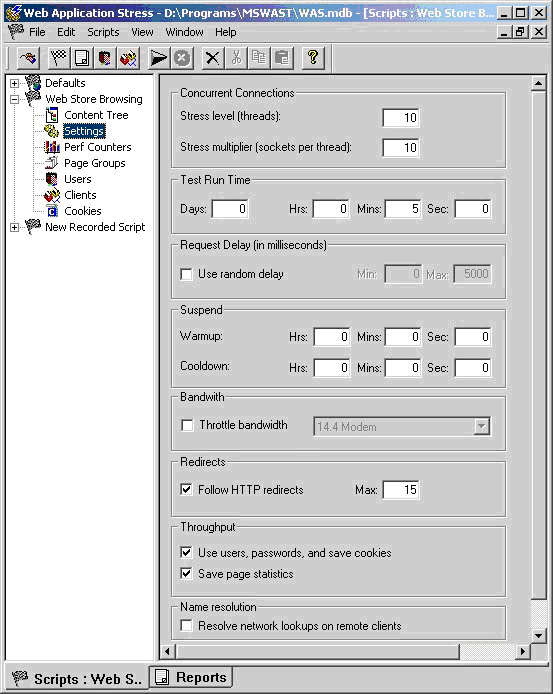
This dialog is your most important tool in tailoring the test for the appropriate load factor on your test Web site. The first items are Stress Level and Stress Multiplier which determine the simulated number of users:
Stress Level
This property determines the number of threads that will be run by WAS to hit the client application.
Stress Multiplier
This property determines the number of sockets that are created on each of the above threads.
The end result is that the Stress Level times the Stress Multiplier equal the number of clients you are simulating. Threads * Sockets = Total clients.
Test Run Time
This option allows you to specify how long to run the test. This is great to start up a test and let it run for exactly 8 hours for example, to see exactly how continuous pounding will affect performance. You can walk away and let WAS do its thing overnight for example**.**
Request Delay
The request delay allows you to provide more realistic user simulation, since users don't continuously click on links as soon as a page loads. Typically users look around a page, find a link and then click it. Even a familiar user may take 5 seconds between requests - new users will take much longer. I'll talk more about when you want to add a delay and when you don't later in the article.
Throttle Bandwidth
This option causes WAS to monitor the traffic being generated both on the outgoing on incoming links and optionally allows limiting the bandwidth available. This is useful if you're generating large amounts of traffic and you may have to contend with the possibility of testing for overloading your incoming Internet pipe. In typical application it takes a huge amount of volume to overflow even a T1 connection, but this may vary depending on your site's content. Even though throttling is available, there's no mechanism in WAS that tells you when you overrun the bandwidth - you have to look at the resulting report for hints of bandwidth usage.
Follow HTTP Redirects
If the tested site includes redirect headers which cause pages to stop executing the current page and instead go to another page, this option allows WAS to follow those redirects. Redirects are common in ASP applications to route code logic from one page to another. Many applications that login or otherwise manually authenticate users tend to often use Redirects. The Max value determines how many successive redirects are followed - one would hope to never see these more than 1 level deep, but the folks of Microsoft were thinking ahead for sick and twisted minds.
The remaining options should be left alone except in special situations - you can review those items in the WAS help file.
Running your script
Once all these settings are configured you're ready to run your script and stress test your application. I suggest you first set up a short logging interval and possibly even a low stress client count to see if everything is working correctly. For example, with my Web Store example I wanted to make sure all the links get hit and I would actually end up with an order in the end of a single script run. If I get an order placed by the test, I know that the user Cookie, user profile attachment, SSL and navigation of the site through the script works correctly. I did this and indeed I ended up with an order in my database.
So, now I want to go in and check the application for load. There are two typical scenarios here:
- Check load with a specific number of user clientsIn this scenario you'll want to set up your WAS Settings with delays between requests to simulate user click habits. Either capture your script with delays or else enter a manual or random delay on the Settings page that closely matches what you think your users would do.
- Check for maximum load of the applicationHere you want to keep increasing the stress levels until you get close to, but not quite to, overrunning the machine's CPU resources. In this scenario, you're typically trying to retrieve a transaction number like - “We're able to take 450,000 backend hits in an 8 hour period”.
Testing for load - an example
The scenario I wanted to test for with my Web Store application is the latter. I just received a new Notebook development machine and I wanted to put it through its paces running the Web store application (to see the actual Web application tested go to: http://www.west-wind.com/wwstore/). I basically want to see how much traffic I can throw at the backend application before it maxes out the machine and starts backlogging requests.
In testing for load I start by going back to the Settings page and setting the Stress Level to 10 and the multiplier to 10 resulting in the equivalent of 100 very efficient, non-stop clicking shoppers on my site.
Now understand that these 100 clients do not match typical clients on the Web site, because no delays are occurring between requests sent by WAS at this time. Keep in mind that real users on a site don't continuously click on links - they have to wait for pages to download and actually look at the content on the page. A user with a fast connection and who knows exactly what he wants may click once every 5-10 seconds, while more typical users will take closer to 20-30 seconds to go to the next page. Others may browse even slower taking a coffee break every ten minutes, checking their email between requests or checking another site for comparable pricing.
My goal here however is to see how well the backend performs and I try to actually run as many hits as I possibly can before the system becomes to loaded: CPU close to 100% and pages returned taking more than 10 seconds from another machine.
With 100 continuous clients I'm not even close to the 100% mark: 35% CPU utilization and when hitting the server with a separate browser any requests are returned immediately. So, I double the count to 200 clients (20 threads/10 sockets). Now things get more interesting - the CPU is running at 75% average with occasional spikes close to 100%. When running browser requests against the server, I now see definite hesitation - responses vary from close to instant to up to 10 seconds or so. This is very close to what I would consider red-line operation of the Web application. It's still keeping up but anything more and it would start keeling over. We've found our max stress level…
However, don't jump to conclusions on short tests of 5 minutes or so. These short burst tests are great for finding starting breaking points, but in order to truly test operation under load you need to stress test for long periods. I like to run my tests over night for at least 8 hours, but ideally you'll want to run for a 24 hour period or more. Why? For one thing applications tend to get more resource hungry the longer they run - it's not uncommon to see slow downs over long periods of hard operation. Also, consider actual data accumulation. In my 8 hour test I accumulated over 48,000 orders written into a SQL database. User Session data is also logged into a SQL table and there were 50,000 user session initiations. Run a test long enough and these numbers get large quickly resulting in slightly slowing access times to the database as the data size grows.
As a side note, figuring out backend slowdowns requires additional logging of requests in your backend application. The Web Store application incidentally provides this logging through the Web framework it runs on (West Wind Web Connection - more about this at the end of the article). Logging is crucial for Web application monitoring, but that's something that needs to be implemented at the Application or Web Framework level - it's not something that WAS will provide you with. In fact, WAS only provides you a summary of the data not the actual detail that you can use to see degradation over time.
In all fairness, though, WAS does provide the ability to log NT Performance counters from the Web server to allow logging of server performance statistics over time. WAS generates a file hcounters.csv which contains these counter values, which you can then manipulate and graph externally (in tools such as Excel for example).
Understanding the test results
I'm now ready to let my test script rip. I set up the script to run for 8 hours over night and wait for the results in the morning. Here's the result sheet from that test:
Overview
==============================================
Report name:            2/20/2000 1:00:09 AM
Run on:                 2/20/2000 1:00:09 AM
Run length:             08:00:00

Web Application Stress Tool Version:1.1.289.1

Notes
----------------------------------------------
Web Store on Rasnote

Number of test clients: 1

Number of hits:        1407757
Requests per Second:   48.88

Socket Statistics
----------------------------------------------
Socket Connects:            1407907
Total Bytes Sent (in KB):   481870.00
Bytes Sent Rate (in KB/s):  16.73
Total Bytes Recv (in KB):   8666648.94
Bytes Recv Rate (in KB/s):   300.93

Socket Errors
----------------------------------------------
Connect:         4
Send:            0
Recv:            0
Timeouts:        0

RDS Results
----------------------------------------------
Successful Queries:   0

Script Settings
==============================================
Server:                       111.111.111.111
Number of threads:            150

Test length:                  08:00:00
Warmup:                       00:00:00
Cooldown:                     00:00:00

Use Random Delay:             No

Follow Redirects:             Yes
Max Redirect Depth:           15

Clients used in test
==============================================
localhost

Clients not used in test
==============================================


Result Codes
Code               Description        Count
==============================================
200                OK                 1407757


Page Summary
Page                             Hits     TTFB      Avg        TTLB   Query
============================================================================
GET /wwstore/                    34384    2344.38   2556.86    No     No
GET /wwstore/wwstore.css         34384    82.94     83.40      No     No
GET /wwstore/images/WestWindSt   34384    31.84     33.14      No     No
GET /wwstore/banners/OOPBook.g   34384    16.49     16.96      No     No
GET /wwstore/space.gif           34384    9.31      9.48       No     No
POST /wwstore/additem.wws?sku=   34374    7.24      1010.32    No     No
GET /wwstore/removeitem.wws?Sk   34366    3067.01   3069.33    No     No
POST /wwstore/ShoppingCart.wws   34358    77.22     1889.93    No     No
GET /wwstore/ShoppingCart.wws    34347    2787.15   2789.42    No     No
GET /wwstore/wwstore.css         34346    79.15     79.66      No     No

... additional data stripped here for size

GET /wwstore/images/wcpower.gi   34265    7.94      8.67       No     No
POST /wwstore/OrderProfile.wws   34256    7.31      1170.45    No     No
GET /wwstore/wwstore.css         34256    73.33     79.51      No     No
POST /wwstore/SubmitOrder.wws    34243    75.33     1056.36    No     No
GET /wwstore/wwstore.css         34243    74.15     75.66      No     No
As you can see there's lots of useful information in this summary. The most useful numbers are the throughput numbers that tell you the total number of hits and how many requests the Web server processed per second. In this example, 1.4 million links were served with an average of almost 49 a second. Impressive for a notebook computer that this sample was run on. Understand that this value is not the number of requests on your backend application, but all links including images and other static pages that the Web server provides.
Also notice the bandwidth information that tells you the average Kbytes received and sent per second. I was a little surprised by how low these numbers are for the amount of traffic generated: 300kb a second average for 1.4 million hits on the Web server in the 8 hour period. That's impressively low (less than a quarter of a T1 connection), but then again the Web Store application is very light on use of images - more image heavy applications will see much higher bandwidth usage.
Looking at the page detail we can see more information about specific requests. For example, it's easy to see which pages are static and which are dynamic based on the request times. TTFB (Total Time the first byte is received) and TTLB (last byte is received) let you get a glimpse at how long (in milliseconds) the client waits for pages. You can easily see the dynamic requests (the .wws pages) taking a couple of seconds as opposed to static links which appear to be next to instant. This can be attributed to the backlog of ISAPI requests in this case. You'll want to watch these numbers carefully in your tests - if the numbers go over 5 seconds you're probably keeping your Web clients waiting too long for each page.
There appears to be a bug with the way the TT values are recorded in the examples above - notice that some of the dynamic pages (.wws) which hit the backend are coming back next to instant (orderprofile.wws) while others (removeitem.wws) are taking 3 seconds. All backend request times are in the 50 millisecond range and all requests are evenly fast. For some reason it looks like POST requests are getting priority processing… in these cases the TTLB value is probably what one should go by. Microsoft is aware of this issue and is working on a fix for future releases. As a work around, you can set up another WAS client running the same script with only a single client - that single client will provide more accurate request retrieval times as there's no interference from multiple clients running simultaneously.
Notice also that WAS does not cache pages like a browser does, so realistically WAS clients are generating more traffic on your Web server than a typical browser would. For example, wwstore.css is the Web store's default Cascading Style Sheet that's used on every page of the store. Typical browsers will cache this static page after the first load. WAS however reloads wwstore.css on every client page that requests it. Note also that the page count is not summarized for all the wwstore.css pages, but rather each client request is separately listed in the link result list. This behavior may change in the future with options for caching provided for WAS clients.
All of this information is very useful as it lets you see how your application performs under a given load. Remember I ran this test without setting up delays between requests which means even 50 clients would easily be able to saturate the backend application as the client will simply have those 50 clients push data down to the client as fast as it can process it! In other words, without delays the number of clients is largely irrelevant - in fact in my tests 50 or 150 performed almost identically. Lower numbers weren't saturating the backend application so the values went down as did the CPU usage. Higher numbers (175 and up actually) started over-saturating the application resulting in slow downs and the TTFB values going up above 5 seconds. Adding more clients could rapidly bring the entire application to an unusable state. However, my goal in this test was to identify how much traffic I can throw at the site, and I have been able to get this information through these tests. I'll look at some additional information that the backend application provided in the next section.
If you want to gauge load for actual user connections you will need to add delays between requests that match the browsing patterns of your users. With delays in place you'll find that you can have lots more users than without delays as the WAS client application is throttled. Regardless of how fast a request finishes the client will have to wait for a specific interval. When I re-ran my tests inserting a 5 second delay I was able to run in excess of 2000 clients before the backend application started bogging down. Note that I had to add users on the Users item of the main script view - the default sets up 200 users. If you run anything more than 200 clients (Threads * Sockets per thread) you have to make sure you add the appropriate amount of users or else you'll get an error message that states the script cannot be run due to too many users for this setup.
Backend Application Logging
In my example of the Web store application, I'm running a Web Connection application, which is Visual FoxPro based pool of COM objects being called of an ISAPI extension. A pool of 4 servers is handling backend requests for database access, and HTML output generation via scripted template HTML pages (similar to ASP).
Understand that your hardware will affect your test environment - obviously a PIII 700 is going to perform differently than PII400. Multi-Processor boxes will drastically change the throughput of your application as opposed to single processor applications. To give you an idea of throughput I was running WAS against my Web Store application on my development notebook:
- A PIII 450 Dell Inspiron 7500 Notebook
- 196 Megs
- Windows 2000, Release
- West Wind Web Connection/FoxPro backend application
- Running 3 pooled COM Server instances
- In the eight hour period of the WAS test it logged:
- 1.4 million Web server requests
- Over 48 requests per second
- Serving 150 non-delayed clients
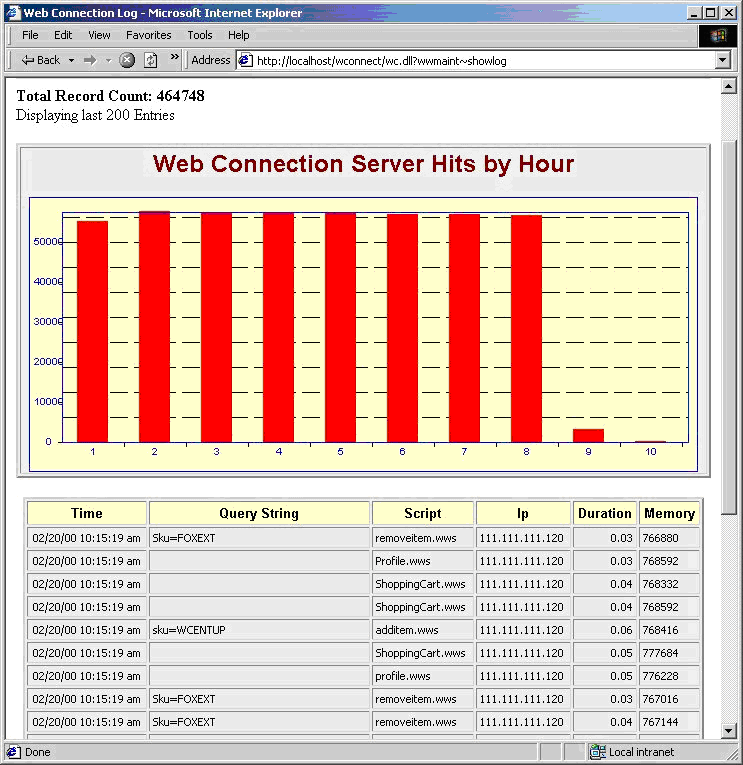
This information is useful, but in reality it doesn't tell me very much about how well the backend application is performing other than it's doing its job. To realistically get performance information about the backend, additional logging by the backend is required. The Web Connection framework happens to handle this optionally as part of the framework. Each hit automatically gets logged into a log file with basic request information - which page, how long it took, the client IP address and a timestamp. This information can be displayed over the Web with a statistics page:
as well as being queried out of a database directly for custom reports.
The HTML summary display in this case includes a graph that shows hourly operation of the backend application as well as quick view of the last 200 requests. You can see that as the test was running about 55,000 backend hits were handled by the Web Connections server every hour the test ran (from 1am to 8am). This makes for the following rates of the backend application:
- 16 requests a second on average
- Peak of 25 requests a second
- 1.3 million requests in a 24 hour period
All of this on a PIII 450 Notebook - imagine performance on a multi-processor server additional memory and faster disk access. It's pretty amazing at what sort of traffic you could potentially handle on a single machine running Windows 2000 these days!
However, it's important to note that 55,000+ hits/hour is pretty close to peak load in this example, so it's unlikely you'd ever see 1.3 million hits in a day. Peaks only occur for a few hours a day typically, the rest of the day is less intense. If load goes above the peak additional hardware would be required either with a better server machine (in this case very likely), or additional machines in a Web farm type pool.
Create and run scripts programmatically
Before we finish up I want to mention that Microsoft Web Application Stress tool even includes a COM component that allows you to control the application without the WAST user interface. You can add files to scripts via code, configure the script options and then start and control the operation of the script (Visual FoxPro code shown below):
oWas = CREATEOBJECT("WAS.EngControl.1")
oScripts = oWas.Scripts

*** Add a new Script
oScript = oScripts.Add()

oScript.sName = "Web Store Test "
oScript.NumberOfThreads = 10
oScript.SocketsPerThread = 10
oScript.TestTime = 150
oScript.sName = "Test Script from VFP"
oScript.ScriptItems.sServer = "111.111.111.111"

*** Must grab script id - or else walk script collection
lnSCriptID = oScript.ScriptID

*** Add Pages to the script
oItem = oScript.ScriptItems.ADD
oItem.sUrl = "/wwstore/default.wws"
oItem.sVerb = "GET"

oItem = oScript.ScriptItems.ADD
oItem.sUrl = "/wwstore/item.wws"
oItem.sVerb = "GET"

*** Now run the script
oWas.ActiveScriptIndex=lnSCriptID
oWas.StartTest(1)
There's much more to the object model including asynchronous operation and a status property you can check for the status of the current test. A complete if somewhat scattered object reference is provided in the help file.
A final word of warning
You should also realize that this tool (and others like it from hacker toolkits to other stress testing tools) has the potential to do great damage to any public Web site! This tool is incredibly easy to use and it's just as easy to point it at an unsuspecting site and cripple its operation as demonstrated by the recent denial of service attacks on large commerce sites (they didn't use WAS but similar tools). If you're on the receiving end of such an attack you need to be able to have information available to identify the problem and be able to take action such as blocking the offending client(s). Logging and frequent monitoring of your applications are the only way to protect yourself from these kinds of attacks if or when they occur. Understanding how a tool like WAS works can help you identify the problem more rapidly and let you hopefully take action to prevent the attack.
You can protect yourself from WAS at least by using a robots.txt file. Robots.txt is used by well-behaved crawlers and other agents to search and index only parts of your Web site you want to have exposed. To keep WAS out of your Web site add the following to your robots.txt file:
Disallow: /
User-Agent: stress-agent
Other stress testing tools or hacker tools won't be so kind so beware… It's really too bad we have to worry about threats like this, but the reality is that if disruption can be caused, somebody will be there to do it. Be aware and keep an eye on your sites.
I want to thank Matt Odhner, program manager for WAS at Microsoft, for his help and clarification of several issues related to this article.