Your application can detect a deadlock and resubmit its transaction, but a better approach is to resolve a deadlock by changing the conditions that lead to it in the first place. In this article, you'll learn how SQL Server deadlocks arise, what types of deadlocks there are, and how you can resolve them.
When your application must handle complex transactions and multiple users, SQL Server deadlocking can be an annoying and difficult problem.
Deadlocking is not a problem that is unique to SQL Server. Any database system that relies on locking to ensure that user transactions do not interfere with each other is subject to deadlock conditions. In order to understand and resolve SQL Server deadlocks, it's important to understand the basic concepts underlying deadlocking in SQL Server.
Deadlocking Concepts
The key concept behind deadlocking is the transaction. To give your users a consistent view of the database, where either all changes in a transactional unit of work succeed or all fail, the database system must lock some resources while the work is being done. A SQL Server deadlock occurs when two or more processes have acquired locks on their respective resource, and they need to get an incompatible lock on the other's resource in order to finish a transaction. The result is mutual blocking: each waits on each other to acquire some resource that the other process already has.
A SQL Server deadlock occurs when two or more processes have acquired locks on their respective resource, and they need to get an incompatible lock on the other's resource in order to finish a transaction. The result is mutual blocking: each waits on the other to acquire some resource that the other process already has.
The result is a situation where neither process can finish. SQL Server's lock manager will detect a deadlock cycle and end one of the transactions. Table 1 shows how, in general, a deadlock occurs.
Read the table from top to bottom, imagining time to progress from instance T1 through T7. By time T3, Transaction1 and Transaction2 have both been granted locks on some resource. At time T4, Transaction1 requests an incompatible lock on the resource already locked by Transaction2, and is blocked. At that point, Transaction1 goes into a wait state, waiting for the lock to be released.
At time T5, Transaction2 requests an incompatible lock on the resource that Transaction1 already has locked. At this point, Transaction2 also goes into a wait state, and each process is blocking the other. This is a deadlock cycle, and here is where SQL Server will detect the deadlock cycle and end one of the transactions.
Types of waits
According to SQL Server Books Online, SQL Server threads can wait on
- Locks
- Parallel query resources
- Other threads
- Memory resource
- Application events
Deadlocking can occur with locks, parallelism, threads, and application events. (Memory waits are resolved by query time-out.) The most frequent source of SQL Server deadlocking is resource locking where the resources are table or index objects.
Deadlocks Involving Locks
Lock-based deadlocks involve two or more threads, at least one transaction, and one or more resources. It's useful to view deadlocks as occurring in two stages. The first is a grant stage, where each thread is granted a lock on its resource. They could be the same resource, but it's much more common that they are different resources.
The second stage is a blocked request where each thread requests an incompatible lock on the other thread's resource. Each thread waits on the other to release its locks before it can complete. SQL Server detects the deadlocked state and rolls back one of the transactions.
Deadlocking is more than blocking. Blocking occurs when one thread is waiting on another, and some brief blocking is normal.
Deadlocking is more than blocking. Blocking occurs when one thread is waiting on another, and some brief blocking is normal. Blocking is expected in any database system that uses locking to maintain transaction isolation. Only blocks with long durations should be considered a problem. In an active system, short periods of blocking may be happening quite often. Lock-based deadlocking is a special type of blocking where two or more threads mutually block each other, and that's what you need to avoid.
How SQL Server handles a Deadlock
In SQL Server 2000, the Lock Monitor thread detects the deadlock. It uses a periodic detection system, inspecting processes about every 5 seconds to determine if there are any deadlock cycles. When it finds one, it automatically chooses one thread as the deadlock victim. It then rolls back the victim thread's transaction, cancels its query, and returns error 1205 to its client.
The Lock Monitor generally chooses the least expensive transaction to roll back. You can override this somewhat using SET DEADLOCK_PRIORITY to LOW for a session. But whenever both threads have the same DEADLOCK_PRIORITY setting, the Lock Monitor will have to choose one of them as the victim.
The message delivered by error 1205 is mysterious or entertaining, depending on your point of view:
Server: Msg 1205, Level 13, State 50, Line 1
Transaction (Process ID 54) was deadlocked
on lock resources with another process and
has been chosen as the deadlock victim.
Rerun the transaction.
Error 1205 is not fatal to the connection; your connection is not terminated. SQL Server aborts the batch, rolls back the transaction, and cancels the query. As a result, error 1205 cannot be detected from within Transact-SQL by @@ERROR within the batch or from calling a stored procedure, because the entire calling batch is cancelled. It has a severity level of 13, correctable by the user, so the client can resubmit the query.
Unfortunately, error 1205 does not tell you the identity of the other participating spid or spids that your process deadlocked with. It also does not reveal statements at the grant or blocked request stage, so you are not sure what commands set up the deadlock conditions in the first place.
SQL Server Deadlocking Factors
You can view deadlocks as containing four factors:
- Lock modes and incompatibility
- Transaction timing
- The order of lock requests
- Isolation level of the transactions
Lock Modes and Incompatibility
SQL Server has a number of lock modes. The most common are listed in Table 2. The core set of locks on resources are the shared and exclusive locks. They can be granted on rows, pages, and tables. These are the types of locks you'll see most often in deadlocks.
The next set, the intent locks, are higher-level locks granted when lower-level locks are also granted. They also can occur in deadlocks, especially the hard ones. The last set, the schema locks and bulk update, are rarely involved in deadlocks.
What's important is that not all of these types of locks are compatible; in fact the majority aren't, as illustrated in Table 3. It can be difficult to find and test lock compatibility. Table 3 is taken from Books Online and enhanced, and I've tested all the combinations that appear there. However, there are other types of locks that may also be incompatible. You can see at a glance, though, that more combinations are incompatible than are compatible.
Transaction Timing
Lock incompatibility is not the only factor in producing deadlocks. Transactions must overlap in time for blocking and deadlocking to occur. Usually that means that the database must be active enough for short transactions to coincide closely in time, or that transactions have sufficiently long duration to make blocking and deadlocking likely. As a result, sometimes deadlocks require a large number of concurrent transactions to surface. When testing your application, you might find that a load of five or ten simultaneous users is not enough to reveal deadlocking, but that a load of twenty users is.
The Order of Lock Requests
The transactions must coincide in time, but they must also grant and request locks in a certain order. That is, the initial locks must be granted before incompatible locks are requested. Sometimes changing the order of lock requests may release locks early or remove incompatible locks.
Isolation Level of the Transactions
Another key component of deadlocks is the isolation level of the transactions. SQL Server has four isolation levels, and the default is READ COMMITTED. That means that your transaction will only read committed data, not uncommitted data. At this level, your transaction must get a shared lock in order to read a resource, and if it is already locked with an incompatible mode, your transaction must wait. If you lower the isolation level to READ UNCOMMITTED, so that you allow the transaction to read uncommitted data, the requirement for shared locks is lifted.
The core set of locks on resources are the shared and exclusive locks. They can be granted on rows, pages, and tables. These are the types of locks you'll see most often in deadlocks.
In the READ COMMITTED and READ UNCOMMITTED isolation levels, shared locks are released as soon as a read query is completed. In the higher isolation levels of REPEATABLE READ and SERIALIZABLE, your transaction will hold the shared locks until the end of the transaction. As a result, the higher isolation levels make deadlocks more likely.
Table 4 summarizes how shared locks behave with various isolation levels. Isolation level is often a critical factor in deadlocking, but not always: deadlocks involving only exclusive locks are independent of the isolation levels, because the isolation levels affect only how shared locks are treated.
You might think that deadlocking involves only exclusive locks, but some deadlocks involving shared locks can occur with the READ COMMITTED isolation level, whereas others involving shared locks require isolation levels higher than READ COMMITTED.
Types of Lock Deadlocks
Deadlocks can involve more than two threads, often quite a number of threads. When many threads are involved in a deadlock, SQL Server will choose one of the threads as a victim, return to the deadlock, choose another thread as a victim, and then eventually narrow the entire deadlock down to a core of two threads.
You can view deadlocks as falling into two categories, depending on whether the transactions initially lock the same or different resources. When the transactions each lock a single resource, let's call that a "single-resource" deadlock, and when there is more than one resource, we'll call that a "multiple-resource" deadlock.
Single-Resource Deadlocks
The single-resource deadlock is sometimes called 'conversion' deadlock, because it occurs when each transaction simultaneously attempts to convert its compatible lock to an incompatible lock.
Mixed X-S deadlocks can be much more difficult to diagnose. They can take place with the default isolation level of READ COMMITTED or higher and involve SELECT statements.
The initial grant stage requires shared locks, because both threads must obtain a lock on a single resource. The single-resource deadlock also requires an isolation level higher than READ COMMITTED so that the share locks will continue to be held through the end of the transaction. The blocked request stage requires exclusive or update locks, locks that are incompatible with shared locks.
Table 5 shows how a single-resource deadlock can occur. The HOLDLOCK hint causes each SELECT to enter into the SERIALIZABLE isolation level, so that the shared locks are held for the duration of the transaction. This is a comparatively rare type of deadlock because the SERIALIZABLE isolation level and HOLDLOCK hint are rarely used in practice.
Multiple-Resource Deadlocks
The multiple-resource deadlock is sometimes called a 'cycle' deadlock, but that is a misnomer. All deadlocks involve a cycle of some kind. This type of deadlock occurs when each thread requests an incompatible lock on the other's resource.
The grant stage normally requires exclusive locks, because shared locks will not be held to the end of the transaction under the default isolation level of READ COMMITTED. There are many variations of the multiple-resource deadlock, but they can generally be classified into two sets.
Some multiple-resource deadlocks involve exclusive locks only; let's call them X-only. In this group, threads make just exclusive lock requests. Others involve mixed exclusive and shared (X-S). First, threads are granted exclusive locks. Then the threads request shared locks and then they are blocked. The mixed X-S deadlocks can be more subtle and challenging.
Table 6 shows how an X-only deadlock can occur. Note that the X-only type of deadlock works at any isolation level, because exclusive locks are always held to the end of a transaction. This is a fairly easy deadlock to detect and prevent. All you have to do is enforce the rule that transactions in stored procedures or other code have to access common sets of tables in the same order.
The X-S, exclusive with shared, type of deadlock is a more complex and subtle type of deadlock. There are many variations: X-X:S-S, X-X-X:S-S-S, X-IS:IS-X, S-IX:IX-S, X-X:U-U, etc. All of these can occur with the READ COMMITTED isolation level, so they are actually the type that you are more likely to see in subtle and complex deadlocks.
Table 7 shows one example of an X-S type of deadlock. Notice in this case that each transaction attempts to read another row in the same table. The rows are the resources that are locked by the transactions.
It might be rather rare that a transaction would want to read another transaction's row just after an update, so Table 8 shows a much more subtle type of X-S deadlock. In this example, each transaction inserts a row into the same table, and then reads the table for more information, perhaps to do another insert. This is a much more common pattern of deadlock, something that transactions in stored procedures are legitimately required to do.
Mixed X-S deadlocks can be much more difficult to diagnose. They can take place with the default isolation level of READ COMMITTED or higher and involve SELECT statements.
Gathering Deadlock Information
There are three basic strategies for gathering deadlock information. You can use the Perfmon Deadlocks/sec counter, inspect the output of the trace flag 1204, and use SQL Trace/Profiler's deadlock events.
Perfmon's Deadlocks/sec Counter
The Perfmon Deadlocks/sec counter is useful in measuring the frequency of deadlocking. It's also useful in multi-user testing to determine the minimum number of users required to reproduce deadlocks. However, it does not show individual deadlocks, it only shows that some deadlocking is occurring.
The 1204 Trace Flag
The output of the trace flag 1204 can be invaluable in diagnosing a deadlock. You set it in combination with the 3605 flag:
DBCC TRACEON(3605, 1204)
Or
DBCC TRACEON(3605)
DBCC TRACEON(1204)
The output of the flag will be sent to the SQL Server error log whenever SQL Server encounters a deadlock. You may find it useful to make a SQL Agent job execute these statements at startup so that the SQL Server error log will always report any deadlocks.
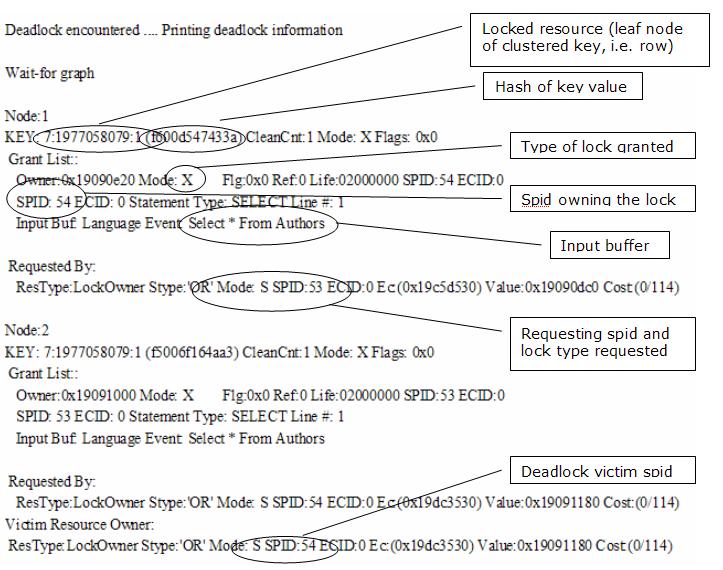
Interpreting the output of the trace flag 1204 can be challenging. Figure 1 shows a sample output and what some of the entries mean.

When you look at the deadlock in Figure 1, KEY: 7:1977058079:1 (f600d547433a) refers to database 7, object id 1977058079, indid 1, which is the clustered index on the authors table. Since it's a key lock, this reflects a row lock on a clustered index. The hash of clustered index key value is f600d547433a. The spid numbers are important when cross-referencing to SQL Trace data. You can see Displaying Locking Information and Troubleshooting Deadlocks in Books Online for more information.
A combination of SQL Profiler and the trace flag 1204 output is the best way to gain information about complex and subtle deadlocks. You can often spot simple deadlocks from either tool and diagnose them quickly.
What the output of the trace flag 1204 shows is the input buffer of the blocked request statements, and the locks held at the grant stage. Unfortunately, it does not show the statements initiating the grant stage locks. Also, the input buffer may be incomplete or truncated.
To get the full transaction history for each spid involved in the deadlock we need to use SQL Profiler and SQL Trace.
Using SQL Profiler to Gather Deadlock Information
SQL Profiler has two important event types that you can use for deadlocks: deadlock and deadlock chain. However, if you supplement your trace with some additional events, you'll get a more readable output. You can select the following events:
- Cursors: CursorExecute, CursorPrepare
- Errors and Warnings: Attentions and Exceptions
- Locks: Lock:Deadlock and Lock:Deadlock Chain
- Stored Procedures: RPC:Completed, RPC:Starting, SP:StmtCompleted, SP:StmtStarted
- Transactions: SQL Transaction
- TSQL: SQL:BatchCompleted, SQL:BatchStarting, SQL:StmtCompleted, SQL:StmtStarting
The Cursors events capture server side cursor queries, Attentions capture timeouts, Exceptions capture SQL Server error events (including error 1205), the RPC counters capture stored procedures executed using SQL Server's RPC interface, and the SP: events capture stored procedures executed as direct SQL. The SQL Transaction event shows when the thread begins a transaction, and the TSQL events capture individual SQL statements. This is a lot of information, and you won't want to use all these counters unless you're zeroing in on an event that you want a lot of data about.
Then you can add the following data columns:
EventClass, EventSubclass, Spid, IntegerData, Mode, StartTime, TextData, DatabaseID, IndexID, HostName, ObjectID, TransactionID, Severity
EventSubclass and TransactionID work with the SQL Transaction event.
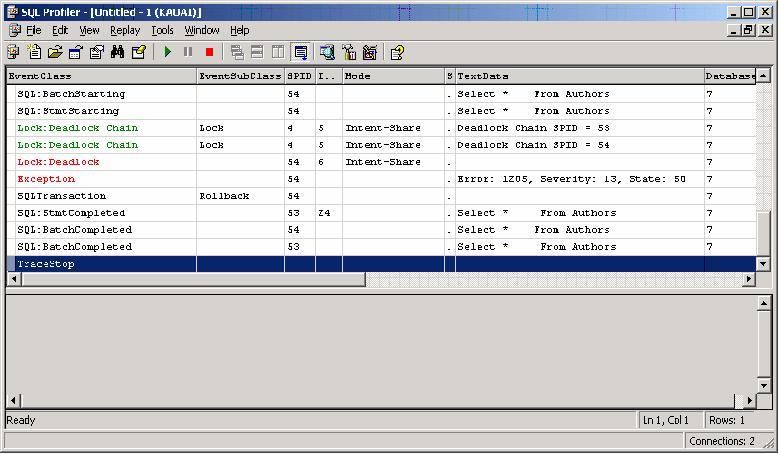
When you view a deadlock in SQL Profiler with the above events and columns, your output will look something like that in Figure 2.

SQL Profiler shows you the statements involved in the deadlock. The deadlock victim will have a statement starting but not ending, if you chose the proper events. You'll also see the beginning and end of each spid's transaction, so you can use SQL Profiler to reproduce each deadlocking spid's transaction history. This can help to produce a reproduction scenario for the deadlock.
Unfortunately, SQL Profiler does not show the statements gaining the initial locks at the grant stage because SQL Profiler does not show locking information. You can choose the locks events, but then the amount of information is voluminous. The trace flag 1204 shows what those locks were, but it does not show what statements were granted the locks.
A combination of SQL Profiler and the trace flag 1204 output is the best way to gain information about complex and subtle deadlocks. You can often spot simple deadlocks from either tool and diagnose them quickly.
Finding the Cause of a Subtle Deadlock
The first step in finding the cause of a subtle deadlock is to find a method to reproduce it. This may involve stress or load testing the system, or just watching it under use. It also helps to find the minimal conditions required for the deadlock, isolating the application behavior so that you can narrow your tracing to just the deadlock behavior.
If you reproduce the deadlock with both 1204 trace flag and SQL Trace active, you can extract the essential data. Examining the trace flag 1204 output will help you identify which spids are involved, and what types of locks lead to the deadlock. You can use SQL Profiler to get each spid's transaction history by saving the SQL Trace data output to a SQL Server table.
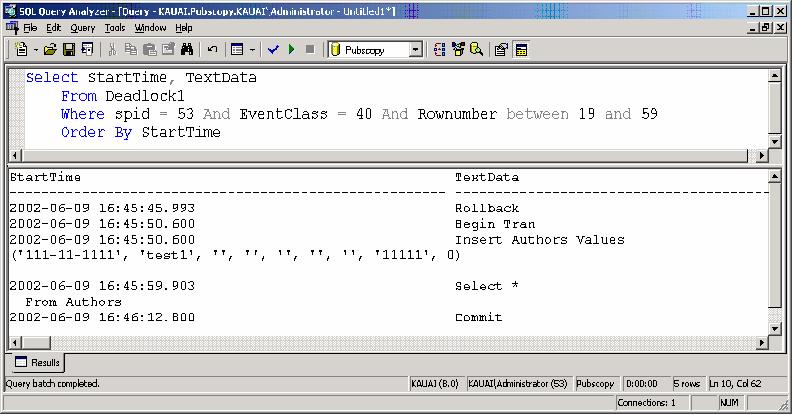
Once you have the trace output in a table, you can query it. Find the beginning and ending row numbers of each spid's transaction, and then select the StartTime and TextData for a given spid. This will give the history of the transaction in question as a series of commands in the Query Analyzer output window. Figure 3 shows a SQL command you can use to extract the transaction history, using the example of an X-S deadlock.

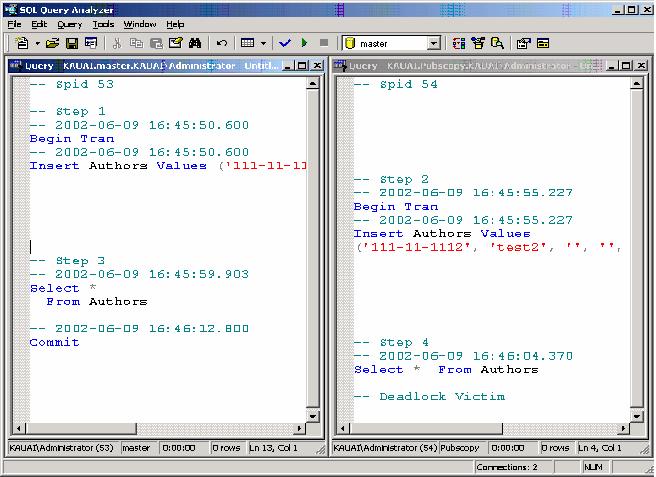
Once you have scripts of the transaction histories from Query Analyzer output, you can arrange the histories according to StartTime, possibly trimming out extraneous commands. You can then reproduce the deadlock under controlled conditions using Query Analyzer. Just put the transaction history scripts side by side and step through the histories command by command, as shown in Figure 4.

This can be very tedious to do, so it's a strategy you'd only use if the deadlock is particularly subtle. However, it will give you insight into the exact cause or causes of the deadlock.
As you're stepping through the transaction histories, you can observe the locks granted and held using sp_lock. When you spot the initial locks granted, and then the lock requests that are waiting, you'll know exactly which commands lead to the deadlock.
Deadlock Resolution Techniques
There are basically four steps you can use to resolve deadlocks. These are:
- Remove incompatible lock requests
- Change the timing of transactions
- Change the order of resource requests
- Change the isolation level
Remove Incompatible Lock Requests
The queries involved may be obtaining too many locks, or locks where they are not needed. This may happen when WHERE clauses are too broad, or broader than the query really needs. For example, a query might be reading a whole table or range of rows where only one row's data is actually desired. Queries may be obtaining or holding the wrong kinds of locks using hints such as HOLDLOCK or UPDLOCK unnecessarily.
Change the Timing of Transactions
You can change the timing of transactions. A deadlock requires transactions to coincide in time, and often they must coincide very closely. Making the transactions shorter or briefer may help, because long transactions increase the likelihood of deadlocks. Perhaps the transactions may not need to overlap in time at all. You might find that batch processes can be run sequentially rather than in parallel, or at a time when users are not online.
Change the Order of Resource Requests
For X-only multiple-resource deadlocks, you should ensure that resources are accessed in the same order. This is a good general rule for stored procedures accessing the same or similar sets of tables. Changing the order of resource requests will not usually work for mixed X-S multiple-resource deadlocks, because they occur when both transactions are accessing resources in the same order.
Change the Isolation Level
Changing the isolation level of queries may sometimes be the only way to resolve stubborn deadlocks. For single-resource conversion deadlocks, you can lower the isolation level of the initial locks, removing SERIALIZABLE transactions or HOLDLOCK hints. For the mixed X-S multiple-resource deadlocks, you can use a locking hint on the share lock queries, which are SELECT statements.
You can use the NOLOCK to lower the isolation level of the query, or lower the entire isolation level of the transaction using SET ISOLATION LEVEL:
SET ISOLATION LEVEL READ UNCOMMITTED
If you do not want your transaction to read uncommitted data, you can use the READPAST hint to have your share lock queries read past a locked resource. This is not the same as lowering the isolation level of the transaction or query because the query will still not read any uncommitted data. Generally using READPAST is a cleaner method of resolving a mixed X-S multiple-resource deadlock than a NOLOCK hint.
Deadlocking can be an annoying problem in an active, transactional system. But with SQL Server Profiler and the output of the trace flag 1204, you can find ways to resolve even the most stubborn deadlocks.


