


Brian Kernighan [1] once said, "Debugging is twice as hard as writing code in the first place. Therefore, if you write the code as cleverly as possible, you are, by definition, not smart enough to debug it." This quote gets a little giggle out of most developers, but on the serious side, there is a lot of truth in it. Writing code that does cool or useful things certainly is much easier than writing code that does cool or useful things reliably.
But why is that exactly? Haven't things gotten considerably easier over the last years and Visual Studio release cycles? Unfortunately, when it comes to quality assurance, the answer is "not really." Sure, debugging has improved a bit. Being able to debug across languages is great. Being able to step into Web services from the client app (at least when both sides are on a local machine, as is often the case during development) is great. But at the end of the day, scenarios have grown in complexity much quicker than debugging and testing tools have been able to keep up with. There are a number of reasons for this.
For instance, distributed scenarios don't exactly make things easier. A lot of work has been done in the area of remote debugging. That's great, but it is still much harder to establish a remote debugging session than it was to step through 15-year old Cobol code. And all the remote debugging functionality assumes that the remote system runs code you can get access to, both technically and from the access rights point of view. Chances are that your application will talk to code that is running on a deployed server you do not have control over. In addition, there's a good chance that the server uses a completely different environment and programming language. Today, we just do not have scenarios where each application stands on its own anymore. Instead, we deal with "software eco systems" that have to interact, communicate, and evolve over time.
The Debugging Challenge
Conceptually, debugging a Visual Studio application is not overly hard. You hit the F5 key, and assuming you are compiling the application in its default "debug" configuration, you are now in debug mode. All you need is to go into single-step mode and add a breakpoint to your code.
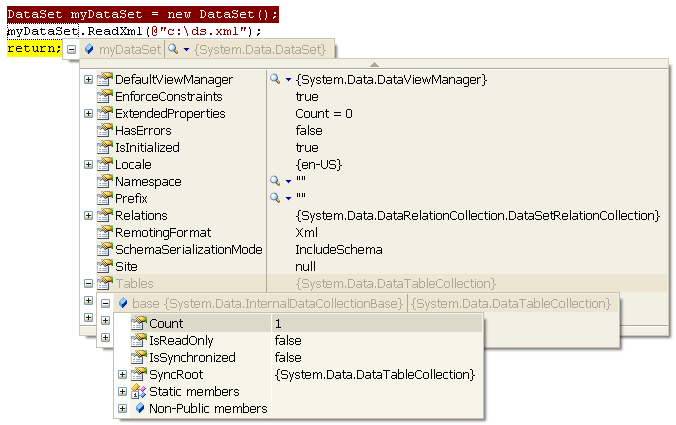
Beyond that, however, things already get tricky! Let's say you have a dataset that does not seem to work as you expect it to. Perhaps the data structure is not as expected, or perhaps it doesn't have the tables you thought were contained in it. How exactly do you find out about these things? Of course, you always have the Watch window. That window might show information similar to the following:
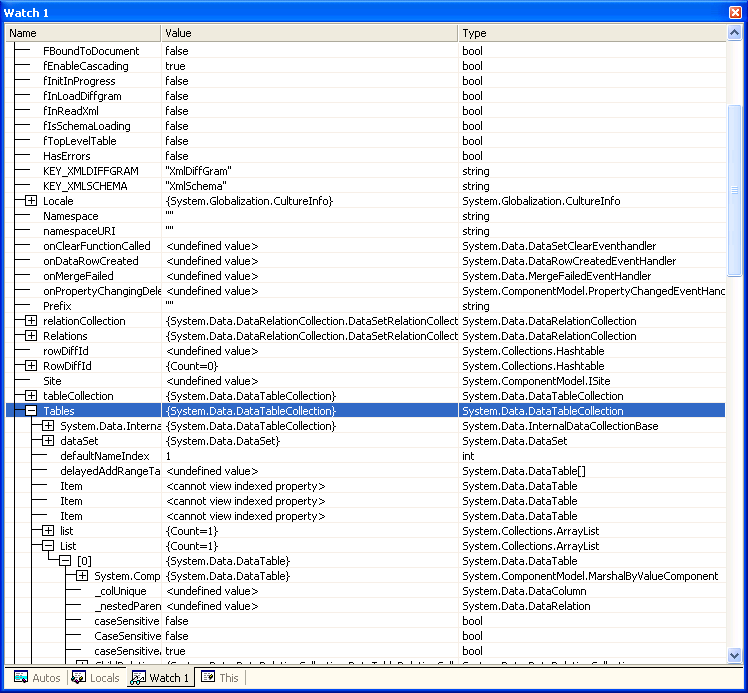
I am sure my readers all recognize this as a dataset that contains all records from the customer table in the Northwind SQL Server sample database. Personally, I have to admit that I find it hard to look at this and make sense of it in a productive manner.
Similarly, I am a bit frustrated when I look at another piece of very basic debug information: the call stack. For this simple example, I wrote a trivial WinForms app that uses the default form every WinForms app has. I dropped a single button on it and used its Click event to write a few lines of simple code that retrieve the dataset. This seems like a trivial scenario, yet consider the screen shot in Figure 2:
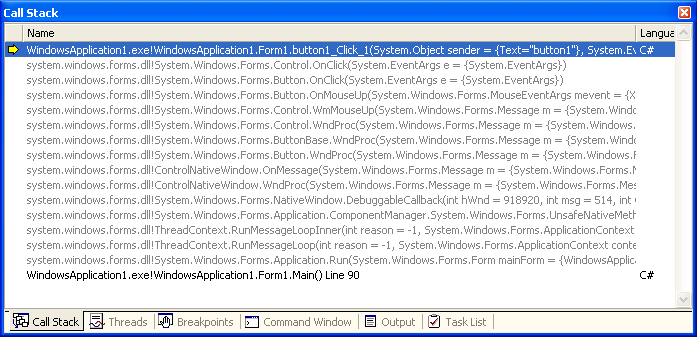
Yikes! I didn't write all of that! Can I figure out what this means? Sure, but why would I? I don't care ,what the Windows message pump does when a button gets clicked. All I care about is the code that is important to me (usually the code I wrote). After all, if there is a problem in any of the code Microsoft wrote, all I can do is write a nasty letter to tech support.
I do, of course, realize that I can hide a lot of this. I can right-click on the header, , "Hide Non-User Code," and all the gray lines will be collapsed and hidden from me. But who knows about this? Or more importantly: Who is least likely to know about this? Answer: less experienced developers. (.NET newbies). And who is most likely to be confused by all this useless information? Aha! The same group of people! A bad combination. In fact, at a recent gathering of developers I attended, I did a quick survey and discovered that the vast majority of developers do not know about the ability to hide "non-user code". I admit this was not quite a scientific study, but it is interesting nevertheless.
Frankly, this situation never fails to amaze me. On one hand, we have what's arguably the best and most productive development environment there is. Visual Studio's code editing capabilities are fantastic. IntelliSense basically writes my code for me. Wizards guide the way. Designers allow me to work on things such as datasets without ever writing a single line of code. Ladies and gentlemen, we are driving the Jaguar of development environments: horsepower, elegance, and luxury at the same time.
But then there is the debug experience. You might now expect me to think of some crappy little car as the counter-part of the Jaguar to drive my point home, and I'd insult a manufacturer while I am at it. But there is no need for this, because when it comes to debugging, we do not even have the equivalent of a car. Nope, not even a horse-carriage. My fellow developers, we are trying to make our way per pedes, and barefoot at that. There is no luxury in sight anywhere. Quite the contrary; if anything, we err on the side of the primitive by adding the ability to perform tasks such as hex-dumps-the digital equivalent of swinging a caveman's club.
Help Is On the Way
Luckily, I am not the only pedestrian who hates walking, and the people at Microsoft have realized that the situation needs attention. Visual Studio 2005 introduces a number of great features that improve the debugging experience. Will it be everything we had ever wished for? Probably not in this release, but the improvements are considerable.
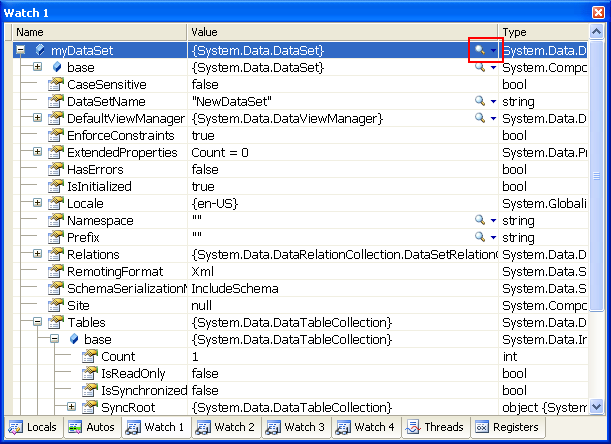
Visual Studio 2005 does clean things up considerably. The Watch window shows information that is truly useful and hides things the typical developer does not care about. In the past, Visual Studio threw as much information as possible at the developer (including things such as private members defined in the framework and other things one didn't even have access to), the new debugger shows information that is a lot more like the information displayed by IntelliSense during editing. Compare Figure 3 to Figure 1 to see what I mean.
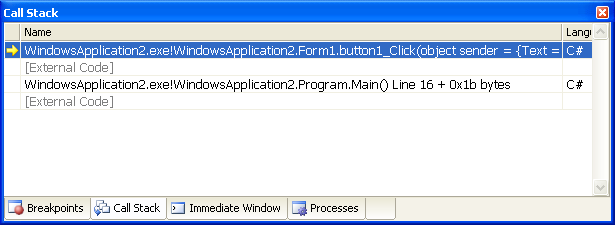
Similarly, Microsoft has cleaned up the Call Stack window to provide a more user-friendly view.
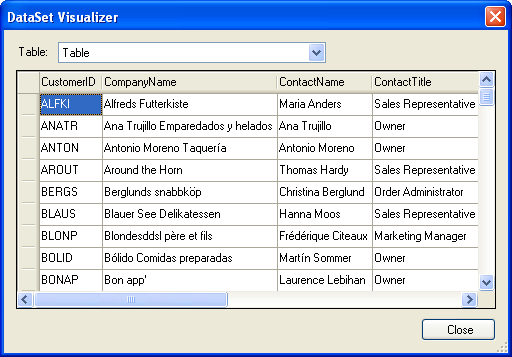
What is more important, however, is that there now are a number of new tools. My personal favorite is a feature called "visualizers." The magnifying glass icon highlighted in Figure 3 launches one of those visualizers (Figure 4). In this example, it is a special visualizer for datasets that shows-eureka!-a grid with the actual data.
What is even nicer is that you don't have to use the Watch window quite as much anymore because a lot of this information is available right in the code window. Simply let your mouse hover over a variable to get an interactive display of the variable's value with full drill down capabilities (Figure 6) instead of the limited tooltips of the past.
Note that visualizers are accessible from this view as well.
Microsoft includes a number of visualizers right out of the box, including visualizers for XML, strings, and other things. However, Microsoft's development teams realize that they can not cater to all needs, so they even allow developers to create their own visualizers. In fact, the March 2005 issue of CoDe Magazine features an article by Julia Lerman (Online Quick ID: 0503061) on this very subject. Make sure to check it out!
There Is Much More, of Course...
There is a lot more to debugging than visualizers, of course, but I think that this is one of many features worth highlighting. Microsoft also improved how they display information contained in error messages. As you know, there is a lot more to writing bug-free code than debugging. You have to test, analyze the coverage of those tests (making sure all lines of code have in fact been tested), profile code performance, analyze the scalability of the overall system, instrument production environments, log bugs, and much, much more. A discussion of all these things is way beyond the scope of this column, but I can tell you that all these areas are vastly improved in Visual Studio 2005 and Visual Studio 2005 Team System. I can also promise that this is not the last time I will bring up this subject. I expect to write future Publisher's Point eColumns, full-featured articles, and I expect to give a few presentations at various conferences on this topic.
[1] Find out more about Brian Kernighan at his homepage: http://www.cs.princeton.edu/~bwk/">http://www.cs.princeton.edu/~bwk/