


This article presents a follow-up to my January/February 2005 article, The Baker's Dozen: 13 Productivity Tips for Crystal Reports and .NET, where I presented productivity tips for developers who use Crystal Reports for .NET.
In this sequel article, Crystal Reports Redux, I’ll offer some changes to the original article and will present some new material for Crystal Reports development. While I’ll focus on the version of Crystal Reports that ships with Visual Studio 2005 Professional, I’ll mention some of the capabilities found in the latest version, Crystal Reports XI.
Beginning with the End in Mind
In preparing this, I re-read the original article and thought about other topics I’d like to cover, as well as topics I’d like to revisit and cover differently. I’ve also received some good e-mail feedback that drove the content of this new article.
Report parameters are a convenient way to add flags to a report, without having to modify the report dataset.
Additionally, I recently finished my book, Pro VS 2005 Reporting using SQL Server and Crystal Reports, which should be available from Apress by the time you read this. The book builds a complete reporting solution in a distributed environment, and contains chapters on stored procedures, Web services/remoting, data access, and report construction/generation. So I’ve been living, eating, and breathing reports for several months now.
In Crystal Reports Redux I’ll present these thirteen productivity tips:
- Creating and using report parameters
- Building a base template report with a generic header and footer annotations
- The Baker’s Dozen Spotlight: Building a reusable .NET library for handling common reporting tasks
- Utilizing our reusable .NET library to preview, print, and export reports
- Building an XY scatter graph
- Better handling of dynamic images
- Specific export options
- Programmatically drilling down to report objects
- Using the “pull model” for an internal reporting application to implement stored procedures and authentication into a report
- Report Page and Section control
- An overview of Crystal Reports in ASP.NET 2.0 Web Forms
- Generating reports against objects instead of datasets
- The Baker’s Dozen Potpourri: some miscellaneous tips for using Crystal Reports
Responding to Prior Comments
My original article, The Baker's Dozen: 13 Productivity Tips for Crystal Reports and .NET, generated some interesting comments on CoDe Magazine’s Web site.
One reader voiced concerns with Tip 11 on printing images dynamically. Unfortunately, at the time Crystal Reports.NET had no native provisions for handling dynamic images, so developers needed to write code to manually load images into a Byte column. While not very elegant, I once had to write a process to print invoices that spanned a large number of images. (Fortunately, the print job was an overnight process.) In Tip 6, I’ll revisit this issue, and show how Crystal Reports XI provides new functionality for handling dynamic images.
Another reader questioned why the article presented separate functions to preview, print, and export reports to PDF when Crystal Reports provides this functionality as part of the Crystal Reports Preview control. Yes, the Crystal Reports Preview control contains buttons for an end user to print or export the previewed report. However, sometimes users want to export or print reports without needing to see the preview. Additionally, a developer may be writing a batch job to print or export reports as part of an overnight process-thus, the requirement to generate reports directly, and outside of the Crystal Reports Preview control.
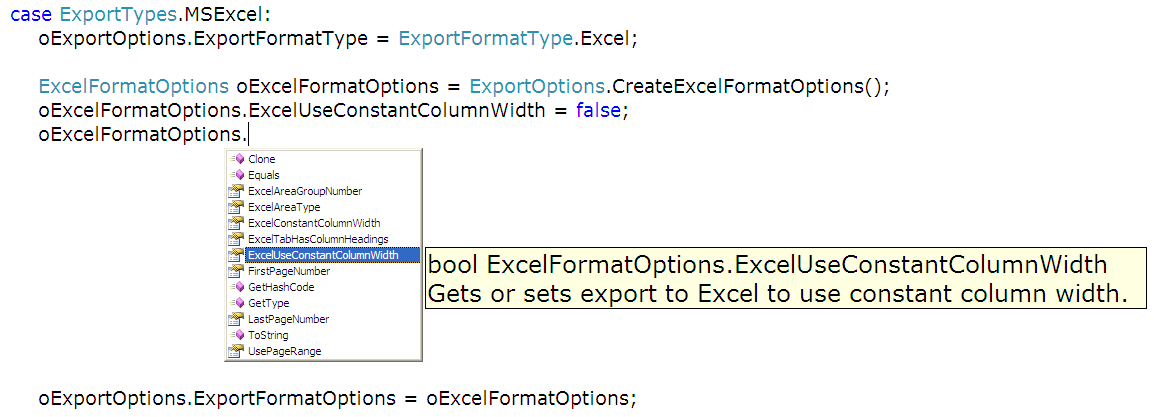
Finally, another reader sent me an e-mail suggestion to improve Excel export options, which I’ll cover in Tip 7.
So to all, thanks very much for your interest and feedback. Starting with this issue, my blog (www.TheBakersDozen.net) will contain a link for each Baker’s Dozen article. Feel free to post comments. (You can also continue to post article comments on the main CoDe Magazine Web site-I’m basically using my blog as a discussion forum ).
Versions of Crystal Reports
Unless I indicate otherwise, all examples in this article use the version of Crystal Reports that ships with Visual Studio 2005. In a few instances, I’ll cover specific functionality for Crystal Reports XI.
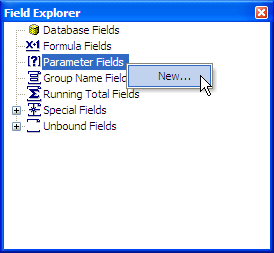
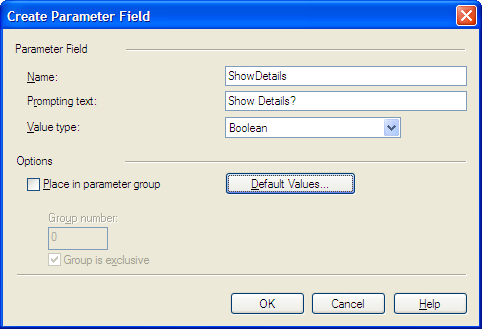
Tip 1: Report Parameters
I want to add a single Boolean flag for my existing report to determine whether to print or suppress a specific section. My report uses a strongly typed dataset as the design-time data source, but I don’t want to add a column to the dataset just for one single flag. Instead, I’d like to add a simple parameter to my report, and then programmatically set the value at run time.
I can implement and use report parameter fields by doing the following:
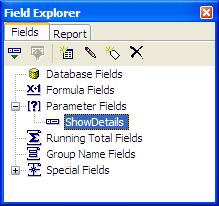
Now that I’ve added the parameter field, I can use it to conditionally suppress the details section (or any other section) when ShowDetails is set to false by doing the following:
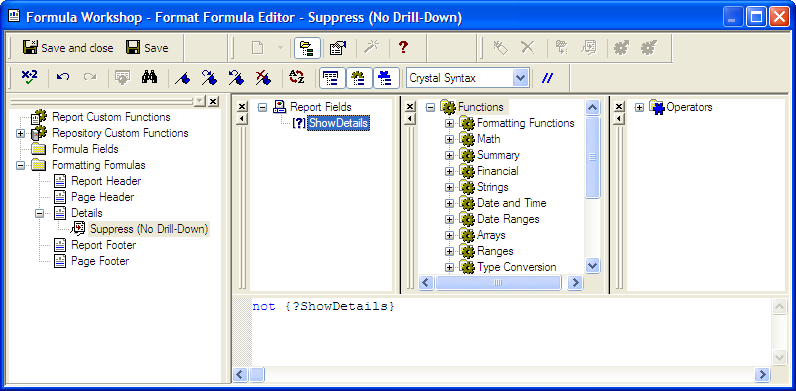
Finally, to set the value at run time, create an instance of the report, and then use the report method SetParameterValue:
bool lShow = true;
oReport.SetParameterValue("ShowDetails", lShow);
Tip 2: Generic Header/Footer and Startup Template
Just like my application screens, I want my reports to have a common appearance and format. Therefore, I want to build a base report template that I can use for all of my reports.
In the original article, I stressed consistency and meaningful annotations in building reports. I left it as an exercise for the reader to build a reusable template with a common header and footer structure. I received some e-mail feedback that some starter examples would have gone a long way.
Annotating reports is like paying insurance premiums: you do it because of the one percent change that it will come in handy someday. How specifically you annotate falls under standards-the fact that you annotate falls under practices.
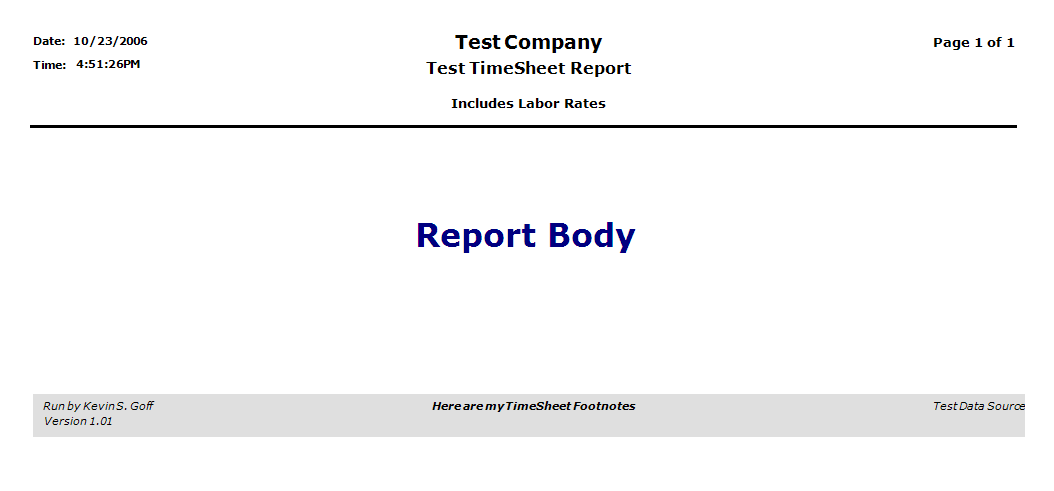
My goal is Figure 5, with a report header that shows company information, date/time printed, the report name and any subtitle information, and the ubiquitous “Page X of Y”. The header contains the name of the user who generated the report, the version of the software, user footnotes, and the data source used for the report. These annotations can prove valuable any time I look at a generated copy afterwards and need to know who generated the report, when, and the database/software version used at the time.
Annotating reports is like paying insurance premiums: you do it because of the one percent chance that it will come in handy some day. How specifically you annotate falls under standards-the fact that you annotate falls under practices.
Building a base template report like the one in Figure 5 involves four steps.
First, I need to build a dataset (dsReportInfo) containing the data elements that I want to annotate. I’ll provide an interface to populate these later in Tip 3. For right now, I’ll identify the elements, as shown in Table 3.
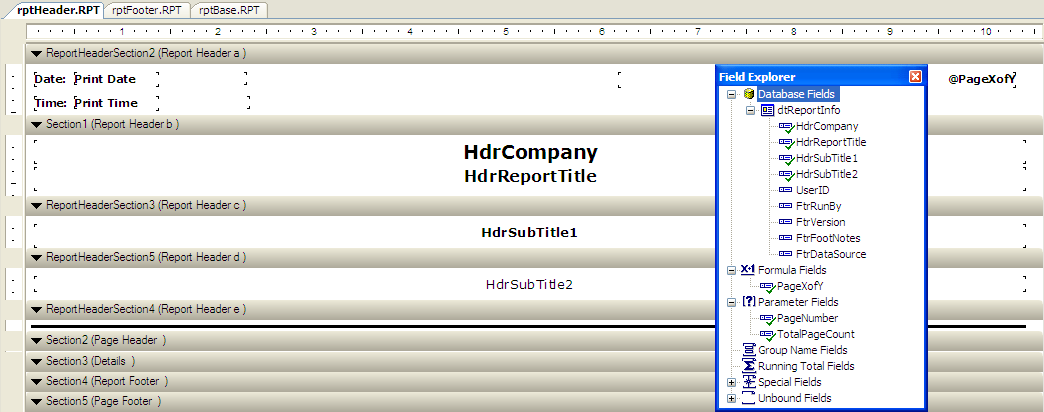
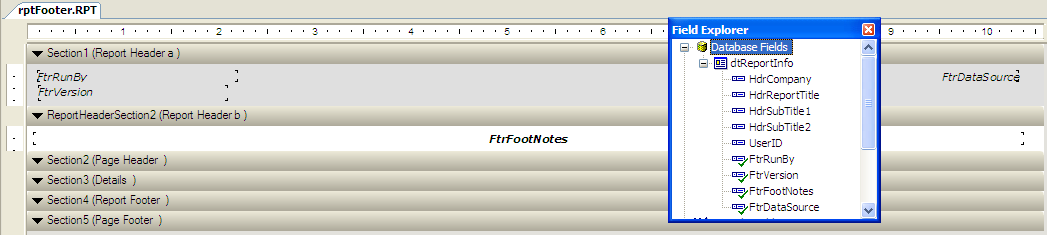
Second, I need to construct the header and footer sections, which I’ll build as separate report files. Figure 6 and Figure 7 show rptHeader.RPT and rptFooter.RPT. Both reports use dsReportInfo as the design-time data source, with fields dragged from the Crystal Reports Field Explorer onto the design area. Note that the header report in Figure 6 contains some parameter and formula expressions for page number, page count, and the page X of Y annotation. I’ll explain this in a few paragraphs.
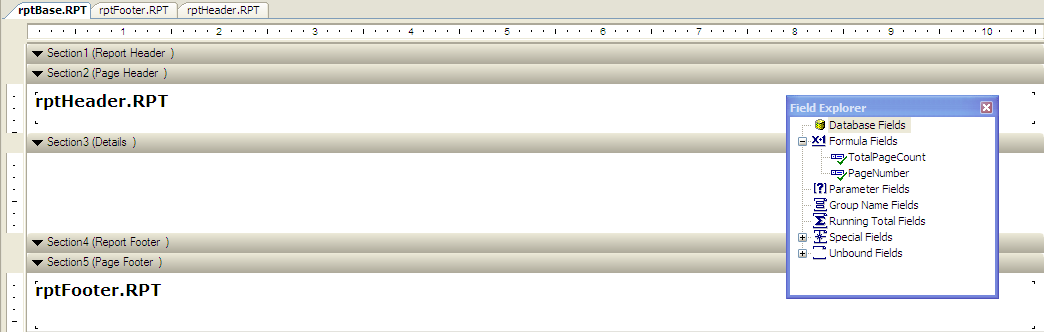
Third, I’ll build a base template report (rptBase.RPT) that incorporates rptHeader.RPT and rptFooter.RPT as subreports (Figure 8). I can do this by creating a new report and inserting the two subreports as follows:
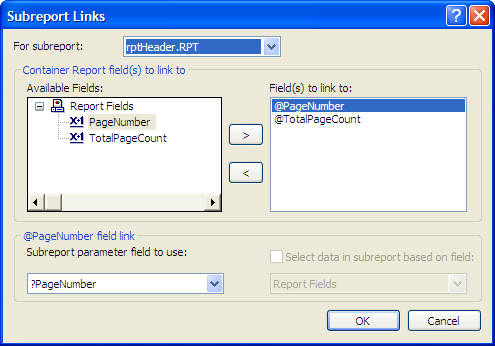
Now, there’s one more thing to make the base template complete. I purposely did not place the standard Crystal Reports special field “Page X of Y” (or Page N of M, as Crystal Reports calls it) in rptHeader.RPT. If I look closely at the upper-right corner of Figure 6, I’ll instead see a custom Crystal Reports formula called @PageXofY. So what gives?
To explain, suppose I had simply placed the standard Crystal Reports Page N of M field in the subreport, inserted the subreport into a base template report, and then used the base for any report that generated more than one page. The subreport would ALWAYS show “PAGE 1 OF 1” on every page. The reason is simple-every time the subreport fires for each page heading in the parent report, it is starting over with a page number and page count of 1. In this situation, the subreport has no knowledge of page information in the parent report.
Crystal Reports, like any other report writer, is a presentation vehicle for your data. So to repeat what was I two years ago, building good reports is all about three things: data, data, and data.
So I need to instruct the parent-base report to tell rptHeader.RPT the current page number and page count from the parent report. Fortunately, I can leverage parameter fields from Tip 1, and then pass the page number and page count as a subreport link from rptBase.RPT to rptHeader.RPT. Follow these steps:
'Page ' + Trim(ToText({?PageNumber},0)) +
 ' of ' +  Trim(ToText({?TotalPageCount},0))
This may seem like a large number of steps, but just like building any component, I only have to go through these steps once.
Finally, I can use rptBase.RPT as the basis for all future reports. When I create a new report, Crystal Reports prompts me to create a new report using the report wizard-as a blank report or from an existing report. By selecting this second option, and then selecting rptBase.RPT, I can build reports using the base report as the template.
Tip 3: Building a Reusable Library for Common Reporting Tasks
I’ve incorporated a handful of reports into my application and find that I’m repeating common tasks for setting the report’s data source, previewing, printing, and exporting the reports. I’d like to build and use a generic set of classes to handle all of these tasks every time.
In my original Crystal Reports article, I presented a project called ccCrystalTools that contained some reusable functionality for previewing and printing reports. I’ve modified and enhanced the library since then. The library provides functionality for many common reporting tasks. The main benefit is that you don’t have to repeat code for using the Crystal Reports object model.
The CGS.CrystalReportsTools library provides functionality for many common reporting tasks. The main benefit is that you don’t have to repeat code for using the Crystal Reports object model.
Figure 10 shows the Visual Studio 2005 project for the library, now called CGS.CrystalReportsTools. The library consists of the following:
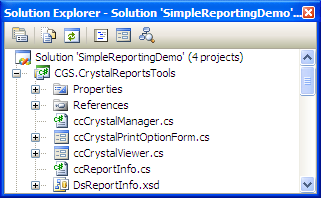
- ccCrystalManager: a class that contains the core functionality for pushing datasets into reports, as well as previewing, printing, and exporting reports. Table 1 and Table 2 lists the public methods and properties for this class. Listing 1 contains the source code for ccCrystalManager.
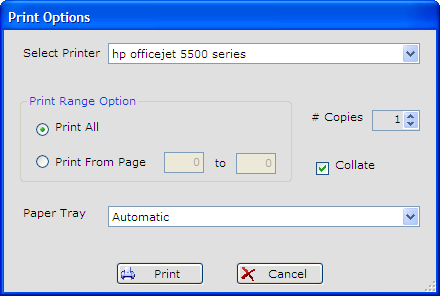
- ccCrystalPrintOptionForm: a reusable print dialog box (Figure 11).
- ccCrystalViewer: a basic Windows Form with a Crystal Reports preview control.
- ccReportInfo: a class to store report header/footer information that I covered in Tip 2. Table 3 lists the properties for this class.
Tip 4: Using the Crystal Reports Library
Sometimes the best way to learn the capabilities of a library is to see code that demonstrates the library. Listing 2 contains sample code to demonstrate virtually every piece of functionality in the CGS.CrystalReportsTools library. The listing creates an instance of a report, and shows how I can use the library to preview, print, and export reports.
Tip 5: More Charting Capabilities
In the January-February 2005 issue, I built common charts such as pie, line, and bar charts. I’d like to look at some additional types of charts.
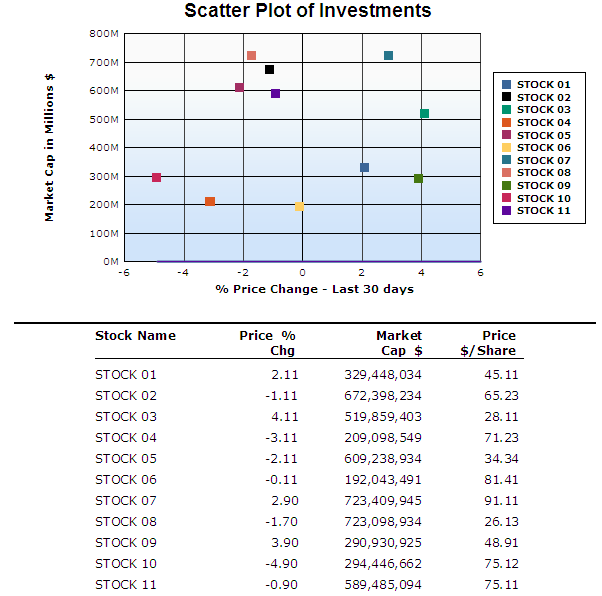
Crystal Reports allows me to develop a wide variety of charts that I can easily integrate with other data bands into a report. Let’s take a look at another chart type-an XY scatter graph.
Figure 13 shows an example of an XY scatter graph for stock/investment information, along with a data summary recap of each stock at the bottom. The scatter graph plots observation points based on two variables: the X-axis represents the percentage of change in stock prices over the last thirty days, while the Y-axis shows the market cap in terms of millions of dollars. Scatter graphs help draw attention to possible correlations between two variables.
As I stated in the initial article, building a chart is about three things: data, data, and data [Big Grin]. I’ll construct a supporting data table, tell Crystal Reports what type of chart I want, and fill in some information on what specific data elements I want Crystal Reports to plot. Here are the details for each step:
First, create a typed dataset called dsScatterGraph with columns for the following:
- A string column for the stock name (StockName)
- A decimal column for the percentage of price change over the last 30 days (PricePctChange)
- A decimal column for the stock’s market cap dollars (MarketCapDollars)
- A decimal column for the stock’s closing price (Price)
Second, create a new Crystal Report and do the following:
- Open the Crystal Reports Database Expert, and select dsScatterGraph as the data source.
- Right-click in the report body and select Insert…Chart. This will launch the Crystal Reports Chart Expert.
- Select the XY Scatter Graph as the Chart Type in the first tab of the Chart Expert.
Finally, I need to tell Crystal Reports which columns to plot:
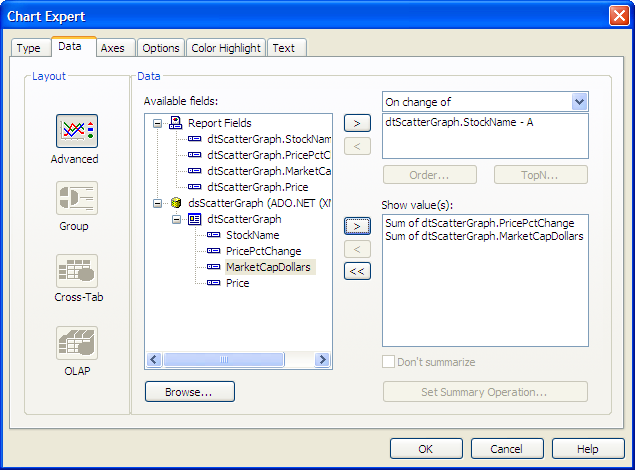
- Click the Data tab of the Chart Expert to select the columns to plot (Figure 12).
- Select StockName as the column to plot for the area called On Change of.
- Select PricePctChange and MarketCapDollars as the column for show values(s). These columns represent the variables for the X and Y axes respectively.
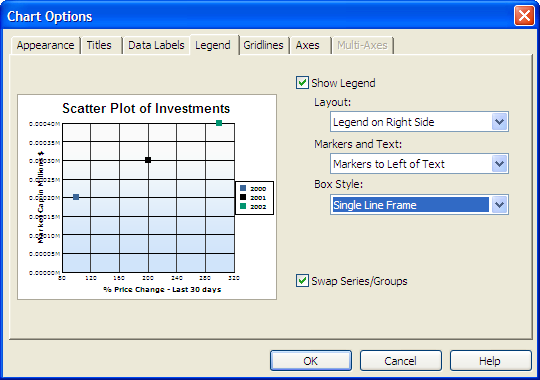
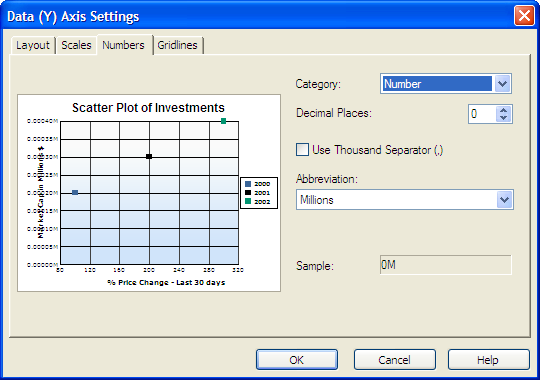
I can also right-click the chart to explore the numerous chart options for setting the legend, gridlines, axis fonts, titles, etc. The chart in Figure 13 shows a legend for each stock and sets the Y-axis to scale values in terms of millions of dollars. I can define a legend by right-clicking the graph, selecting chart options, and then clicking the Legend tab (Figure 14). To set the scale of the Y-axis, right-click the Y-axis options, and then select the option for Data (Y) axis options. This will load the Data (Y) axis settings screen (Figure 15), where I can go to the Numbers tab and set the scale accordingly.
Tip 6: Better Handling of Dynamic Images
I want to generate customer invoices and display the customer logo at the top. The images are stored on a shared network drive.
Depending on whether I’m using Crystal Reports XI, or previous versions of Crystal Reports.NET, there are two ways to handle this.
Seek and use every information resource available to you to master Crystal Reports-from object discovery in IntelliSense to online examples to the list of available Crystal Reports functions in the Crystal Reports Formula Editor.
In Crystal Reports.NET, the only way I could generate images dynamically was to define a DataColumn in my result set to store the image, insert the DataColumn on the report at design time as a BLOB field, and then populate the data column with the appropriate picture file at run time.
So first, define a new data column in the report DataTable. Since this is a client logo, call the column ClientLogo. The DataType must be base64binary, which I can set in the XML Schema Editor for the typed dataset. Alternatively, I can define the data type as a byte array (System.Byte[]) in the standard DataSet Editor.
Second, after I define the binary column in the result set, I must insert the column in the report design area. Note that Crystal Reports will treat the column as a BLOB object, which I can then size and position as needed.
Finally, I need to populate the image at run time when I populate the rest of the result set contents. The sample below is the code for creating a binary reader and inserting the picture image into the dataset.
dsInvoices odsInvoices = new dsInvoices();
string cPicFileName = "c:\\MyLogo.JPG";
// Must create a stream and a reader, from the
// System.IO namespace
FileStream fsStream =
    new FileStream(cPicFileName, FileMode.Open);

BinaryReader br = new BinaryReader(fsStream);
// create an instance of the new datarow
dsInvoices.dtInvoicesRow oRow =
     odsInvoices.dtInvoices.NewdtInvoicesRow();
// Set the logo, and any other columns
oRow.ClientName =
     br.ReadBytes((int)br.BaseStream.Length);
odsInvoices.dtInvoices.AdddtInvoicesRow(oRow);
While this works, it does mean that I’ll be creating a large dataset if I have many large images. Fortunately, Crystal Reports XI improves on this by allowing me to simply specify the name and location of an image, and then the report will load the image.
First, in the report DataTable, I simply create a string DataColumn to store the full name and location of the image. The location can be a local drive, network shared drive, or even a URL.
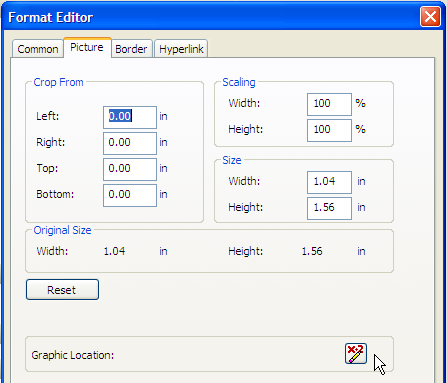
Second, in the Crystal Reports XI designer, I need to drop a picture/image control on the report body. Then right-click the picture and select Format Object on the shortcut menu. This will load the Format Editor. Go to the Picture tab, as shown in Figure 16, and then click the formula icon to the right of the Graphic Location option. This will load the Formula Editor, where I can specify the following formula for the Graphic Location. The formula is simply the table name and column that stores the reference to the image (dtInvoiceHeader.ClientLogoName).
Tip 7: Details on Export Options
A few months ago, a reader named Rob Richardson sent me an e-mail regarding my original Crystal Reports article. He pointed out that the original export library in my code used the PdfRtfWordFormatOptions class to set the format options for the export, regardless of the export destination. He then suggested that I use the ExcelFormatOptions class to set format options for exports to Microsoft Excel.
So the export function in Listing 1 reflects this change. Thanks very much, Rob!
Tip 8: Drill Down to Controls in the Object
I want to programmatically format a specific report object, where the object does not contain a format display formula at design time. While I can set most formatting options, such as font characteristic, through display formulas, there are other options I cannot set. Therefore, I want to handle this programmatically at run time.
A few report objects, such as the line object and box objects, do not contain formula fields to conditionally suppress the objects. In some instances, I might be able to place the line/box objects in a section and use a formula for the section; in other cases, the location of the line/box objects may not lend itself to a section.
Some developers view reports as busy work. But they are the bridge between the data that you see, and the information that clients and users expect from the system.
Fortunately, the Crystal Reports object model allows me to drill down through the report and section area objects and access properties that aren’t accessible through formulas. The following code shows two different ways to suppress a line/box object. If I know the actual names of the report objects, I can access them specifically.
// uses the namespace
// CrystalDecisions.CrystalReports.Engine

RPT_Invoice oReport = new RPT_Invoice();

Section oSect =
   oReport.ReportDefinition.Areas[1].Sections[0];

oSect.ReportObjects["lPageHeaderLine"].
     ObjectFormat.EnableSuppress = true;

oSect.ReportObjects["lPageHeaderBox"].
     ObjectFormat.EnableSuppress = true;
If I don’t know the specific object name, but I do know that the line and box that I want to suppress are the only line and box objects in the section, I can loop through the objects in the section area, check each object’s type, and suppress it accordingly.
RPT_Invoice oReport = new RPT_Invoice();

foreach (ReportObject orb in oSect.ReportObjects)
     if (orb is LineObject || orb is BoxObject)
          orb.ObjectFormat.EnableSuppress = true;
If you’re already familiar with this technique, you may ask if you can use this to tap into other report objects, specifically options within a Crystal Reports chart. Unfortunately, chart objects are more of a “black box” -you cannot drill into the object hierarchy to set things like pie chart colors and other aspects of a chart.
Some developers choose to get around this by using a third-party charting tool to build the graph to an image, and then import the image into the report. Some use the product CRChart by ReCrystallize Software, a tool that expands the charting capabilities of Crystal Reports.
Tip 9: Using the Pull Model for Internal Applications-Stored Procedures, and Authentication
The previous article and this article have stressed the push model, where you use XML/dataset data to push into the report at run time. This is the most effective model, and the ONLY model when working in a distributed environment. However, when building internal applications, I may just want the reports to pull results directly from a database stored procedure using the required login credentials.
I have strived to design my reports against a common format (XML/XML Schemas) and to keep database information out of the report. However, some applications may run directly off an internal database server. These systems will often have the reports, database server, and application all under one roof. In this situation, developers will commonly design the reports against an internal server using database stored procedures as the report’s data source. Then they will set up a basic interface where internal users will run them off a different server that contains the same stored procedures.
Crystal Reports, like any other report writer, is a presentation vehicle for your data. So to repeat what was I two years ago, building good reports is all about three things: data, data, and data.
To accomplish this, I need to do the following, as shown in Listing 3:
Keep in mind that the authentication code in Listing 3 must be applied to every data table in the report, which includes any subreports. Sometimes you will see a “login failed” message from Crystal Reports when generating reports-this is often due to one or more of the report data tables not being covered by authentication code.
Tip 10: Page and Section Control
I need to print addresses on a report, where some address records need two lines and others only need one. If an address line is blank, I want the report to suppress the address line and move the following line up. That way, they’ll print in proper form, so that no empty address lines appear in between.
Additionally, the report also contains a standard terms and conditions clause that prints in between sections of a report. The content is variable and can span many lines. I want to make sure that the content always prints on the same page, even if it means starting a new page.
Figure 18 shows how I can address the issue of multiple addresses where some can be blank. I can right-click in the main report body and load the Section Expert. This allows me to insert multiple subsections within a section, one for each possible address line. For each inserted section in the Section Expert, select the check box to Suppress Blank Section.
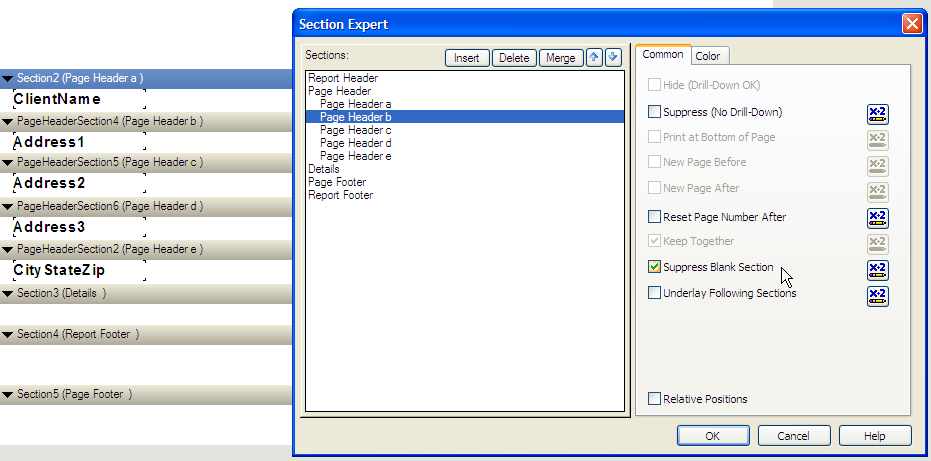
To protect a section against being split across two pages, select the check box in the Section Expert to Keep Together (Figure 18). In this example, if I place a Terms and Conditions column in a separate section, and turn on the option to Keep Together, the content will always print on the same page. This is basic “widow/orphan” protection for a section.
If you need more expansive window/orphan protection for an entire group, check out the same option in the Crystal Reports Group Expert.
Tip 11: Using Crystal Reports in ASP.NET 2.0 Web Forms
ASP.NET 2.0 includes an enhanced ReportViewer and CrystalReportSource control, as well as a new CrystalReportsPartViewer control. The latter allows me to work with ASP.NET 2.0 Web Parts, which let me work with individual sections of a page. The enhanced ReportViewer allows users to preview and navigate through a report using a preview toolbar similar to that found in the Crystal Reports Windows Forms toolbar. A future Baker’s Dozen article will cover ASP.NET 2.0 data-driven Web applications and Web reporting.
Tip 12: Generating Reports Against Custom .NET Classes Instead of Datasets
I prefer to work with data in custom classes and custom collections, as opposed to datasets. I’d like to generate a report directly against those objects, without having to use datasets.
In both the original article and this article, I’ve focused on datasets as the design-time and run-time source for the push model. However, I can also push .NET custom collections into a report.
Listing 4 shows a basic class with two simple properties for name and salary called TestReportInfo. I can set this class as the design-time data source for a test report, by doing the following:
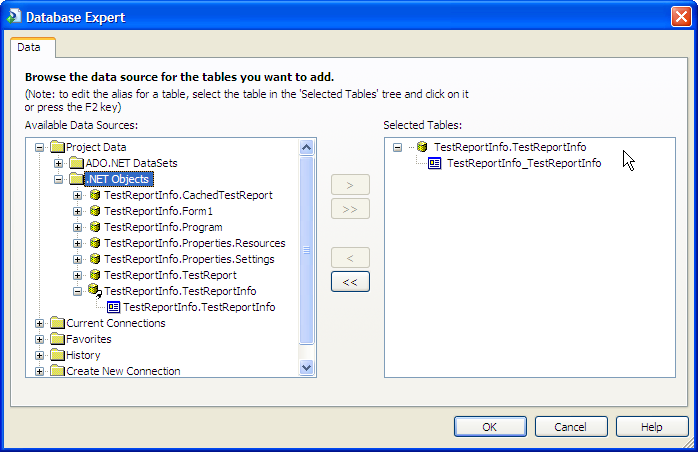
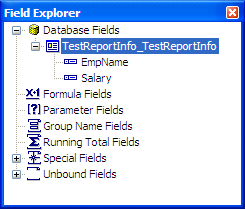
That covers the design-time aspect-what about pushing a collection of objects into the report at run time? It’s just as easy. Listing 5 shows how I can create a List object (using the new .NET 2.0 Generics namespace) to store multiple instances of the TestReportInfo class. Then I can instantiate the report object and use the report’s SetDataSource method to push the List object into the report.
So I can push a DataSet, DataTable, DataReader, or (in this instance) anything that implements System.Collections.IEnumerable into a Crystal Reports report.
Additionally, if I’m using Crystal Reports XI, I can now pass a DataView object. Prior versions of Crystal Reports did not support the DataView object. So if I’m using anything prior to Crystal Reports XI and want to push the contents of a DataView into a report, I have two choices:
If I’m using Visual Studio 2005, I can use the new ADO.NET method, DataView.ToTable, to convert the view to a table.
If I’m using Visual Studio 2003, I can use the following code to create a DataTable from a DataView:
public DataTable ViewToTable(DataView dv)
{
     // Create a new table structure from the
     // table object of the view, and then loop
     // through the view and import the rows into
     // the new table

     DataTable DtReturn = dv.Table.Clone();
     foreach (DataRowView drv in dv)
          DtReturn.ImportRow(drv.Row);

     return DtReturn;
}
Tip 13: A Potpourri of Reporting Tips
Question: How do I convert a numeric column to a string?
Answer: Create a Crystal Reports formula that uses the Crystal Reports ToText function, which converts numeric data to string. The function also contains overloads, allowing me to specify the number of decimals in the return string. This helps in instances where I have a value of 123.00 and want to return a string that reads “123”.
Question: How can I display a column of data in a different color, based on some condition?
Some developers view reports as busy work. But they are the bridge between the data that you see, and the information that clients and users expect from the system.
Answer: Create a Crystal Reports formula that compares the column to another threshold column, and then returns a Crystal Reports constant for the color. Insert the formula into the report by doing the following:
if {MyData.Costs} > MyData.CostThreshold} then
    crRed
else
    crBlack
Question: How can I save the image of generated reports, in an audit trail fashion, so that anyone can go back and see what was actually generated at the time?
Answer: One technique is to automatically save the report as PDF to a shared location when the user prints the report. The library in Tip 3 makes this process very easy. You can create a database table that logs each instance (who generated the report, when, the name of the PDF, etc.)
Question: How do I programmatically set print options beyond those specified in my print library?
Answer: Access the print options class inside the report object. Here’s a code sample that shows some different possibilities:
using CrystalDecisions.Shared;

RPT_Invoice oRpt = new RPT_Invoice();
oRpt.PrintOptions.PrinterName = "printer name";

oRpt.PrintOptions.PaperSize =
                 PaperSize.Paper10x14;
oRpt.PrintOptions.PaperSource =
                 PaperSource.Envelope;
oRpt.PrintOptions.CustomPaperSource =
                 PaperSource.Envelope;
oRpt.PrintOptions.PaperOrientation =
                 PaperOrientation.Landscape;
Closing Thoughts
Have you ever submitted something (an article, a paper, some code, etc.) and thought of some good ideas AFTER the fact? Well, I’m the king of thinking of things afterwards. Fortunately, that’s the type of thing that makes blogs valuable. Check my blog (www.TheBakersDozen.net) for follow-up tips and notes on Baker’s Dozen articles…and maybe a few additional treats!
Listing 1: ccCrystalManager.cs
using System;
using CrystalDecisions.CrystalReports.Engine;
using CrystalDecisions.Shared;
using System.Data;
using System.Windows.Forms;
using System.Collections;
using CrystalDecisions.Windows.Forms;


namespace CGS.CrystalReportsTools
{
   /// <summary>
   /// Summary description for Class1.
   /// </summary>
   ///

   // properties

   public class ccCrystalManager
   {


        public enum ExportTypes
        {
            PDF = 1,
            MSWord = 2,
            MSExcel = 3,
            HTML = 4

        }
      // properties used by the generic print routine


      private static string  _cPrinterName;
      public string cPrinterName
      {
         get {return _cPrinterName ;}
         set {_cPrinterName = value;}
      }


      private static int  _nCopies;
      public int nCopies
      {
         get {return _nCopies ;}
         set {_nCopies = value;}
      }

      private static bool  _lAllPages;
      public bool lAllPages
      {
         get {return _lAllPages ;}
         set {_lAllPages = value;}
      }


      private static bool  _lPageRange;
      public bool lPageRange
      {
         get {return _lPageRange ;}
         set {_lPageRange = value;}
      }


      private static int  _nStartPage;
      public int nStartPage
      {
         get {return _nStartPage ;}
         set {_nStartPage = value;}
      }

      private static int  _nEndPage;
      public int nEndPage
      {
         get {return _nEndPage ;}
         set {_nEndPage = value;}
      }

      private static bool  _lCollate;
      public bool lCollate
      {
         get {return _lCollate ;}
         set {_lCollate = value;}
      }

        public ccCrystalManager()
      {
         this.nCopies = 1;
         this.nStartPage = 0;
         this.nEndPage = 0;


         this.cPrinterName = "";
         this.lAllPages = true;
         this.lPageRange = false;
         this.lCollate = true;


      }


      public ReportDocument PushReportData
              (DataSet DsReportData, ReportDocument oReport)
      {
      // Called when a report is generated
      //   Calls SetData for the main report object
      //   Also calls SetData for any subreport objects

         this.SetData(DsReportData,oReport);

         foreach(ReportDocument oSubReport in
                                            oReport.Subreports)
            this.SetData(DsReportData,oSubReport);

         return oReport;

      }

        private void SetData
                   (DataSet DsReportData, ReportDocument oReport)
        {
        // receives a DataSet and a report object (could be the
  // main object, could be a subreport object)

        // loops through the report object's tables collection,
        // matches up the table name with the corresponding table
        // name in the dataset, and sets the datasource accordingly

        // This function eliminates the need for a developer to
        // know the specific table order in the report

            foreach (Table oTable in oReport.Database.Tables)
               oTable.SetDataSource
             (DsReportData.Tables[oTable.Name.ToString()]);

        }


        public void SetReportInfo
               (ReportDocument oReport, ccReportInfo oReportInfo)
        {

            // This is a typed dataset that's part of the project
            DsReportInfo odsReportInfo = new DsReportInfo();
            DsReportInfo.dtReportInfoRow oHeaderFooterRow =
                 odsReportInfo.dtReportInfo.NewdtReportInfoRow();


            oHeaderFooterRow.FtrDataSource =
                                    oReportInfo.FtrDataSource;
            oHeaderFooterRow.FtrFootNotes =
                                    oReportInfo.FtrFootNotes;
            oHeaderFooterRow.FtrRunBy = oReportInfo.FtrRunBy;
            oHeaderFooterRow.FtrVersion = oReportInfo.FtrVersion;
            oHeaderFooterRow.HdrCompany = oReportInfo.HdrCompany;
            oHeaderFooterRow.HdrReportTitle =
                                    oReportInfo.HdrReportTitle;
            oHeaderFooterRow.HdrSubTitle1 =
                                    oReportInfo.HdrSubTitle1;
            oHeaderFooterRow.HdrSubTitle2 =
                                    oReportInfo.HdrSubTitle2;
            oHeaderFooterRow.UserID = oReportInfo.UserID;
            odsReportInfo.dtReportInfo.AdddtReportInfoRow
                                 (oHeaderFooterRow);

            this.PushReportData(odsReportInfo, oReport);

        }


        public ccCrystalViewer PreviewReport
                 (ReportDocument oReport, string cTitle,
                                         DataSet DsReportData)
        {
            // Overload of PreviewReport, if I want to push data,
            // and then run the report in one method
            this.PushReportData(DsReportData, oReport);

            return this.PreviewReport(oReport, cTitle);

        }


        public ccCrystalViewer PreviewReport
                 (ReportDocument oReport, string cTitle)
        {
            ccCrystalViewer oViewer = new ccCrystalViewer();
            oViewer.crViewer.ReportSource = oReport;
            oViewer.crViewer.Zoom(100);
            oViewer.Text = cTitle;
            oViewer.ShowDialog();

            return oViewer;
        }


        public void PrintReport(ReportDocument oReport)
        {
            oReport.PrintOptions.PrinterName = this.cPrinterName;


            oReport.PrintToPrinter
                  (this.nCopies, this.lCollate,
                  this.nStartPage, this.nEndPage);

  }


        public void ExportReport
              (ReportDocument oReport,string cFileName,
                                ExportTypes oExportTypes)
        {
            this.ExportReport(oReport, cFileName,oExportTypes,0,0);
        }


        public void ExportReport
            (ReportDocument oReport, string cFileName,
                    ExportTypes oExportTypes,
                    int nFirstPage, int nLastPage)
        {
            ExportOptions oExportOptions = new ExportOptions();
            PdfRtfWordFormatOptions oFormatOptions =
                  ExportOptions.CreatePdfRtfWordFormatOptions();
            DiskFileDestinationOptions oDestinationOptions =
                  ExportOptions.CreateDiskFileDestinationOptions();


            switch (oExportTypes)
            {

                case ExportTypes.PDF:
                    oExportOptions.ExportFormatType =
                            ExportFormatType.PortableDocFormat;

              // this code for setting page range is
                    // repeated for the different export types

                    // It would be great to use .NET generics,
                    // but the different export types
                    // don't implement a common interface

                    if (nFirstPage > 0 && nLastPage > 0) {
                         oPDFFormatOptions.FirstPageNumber =
                                                      nFirstPage;
                         oPDFFormatOptions.LastPageNumber =
                                                      nLastPage;
                         oPDFFormatOptions.UsePageRange = true;
                    }

                    PdfRtfWordFormatOptions oPDFFormatOptions =
                     ExportOptions.CreatePdfRtfWordFormatOptions();
                    oExportOptions.ExportFormatOptions =
                            oPDFFormatOptions;

                    break;
                case ExportTypes.MSWord:
                    oExportOptions.ExportFormatType =
                            ExportFormatType.WordForWindows;

                    PdfRtfWordFormatOptions oWordFormatOptions =
                     ExportOptions.CreatePdfRtfWordFormatOptions();

                    if (nFirstPage > 0 && nLastPage > 0) {
                         oWordFormatOptions.FirstPageNumber =
                                                      nFirstPage;
                         oWordFormatOptions.LastPageNumber =
                                                      nLastPage;
                         oWordFormatOptions.UsePageRange = true;
                    }

                    oExportOptions.ExportFormatOptions =
                             oWordFormatOptions;

                    break;

                case ExportTypes.MSExcel:
                    oExportOptions.ExportFormatType =
                          ExportFormatType.Excel;

                    ExcelFormatOptions oExcelFormatOptions =
                         ExportOptions.CreateExcelFormatOptions();
                    oExcelFormatOptions.ExcelUseConstantColumnWidth
                          = false;

                    if (nFirstPage > 0 && nLastPage > 0) {
                         oExcelFormatOptions.FirstPageNumber =
                                                      nFirstPage;
                         oExcelFormatOptions.LastPageNumber =
                                                      nLastPage;
                         oExcelFormatOptions.UsePageRange = true;
                    }

                    oExportOptions.ExportFormatOptions =
                          oExcelFormatOptions;

                    break;

                case ExportTypes.HTML:
                    oExportOptions.ExportFormatType =
                                ExportFormatType.HTML40;

                    HTMLFormatOptions oHTMLFormatOptions =
                        ExportOptions.CreateHTMLFormatOptions();

                    if (nFirstPage > 0 && nLastPage > 0) {
                         oHTMLFormatOptions.FirstPageNumber =
                                                      nFirstPage;
                         oHTMLFormatOptions.LastPageNumber =
                                                      nLastPage;
                         oHTMLFormatOptions.UsePageRange = true;
                    }
                    // can set additional HTML export options here

                    oExportOptions.ExportFormatOptions =
                        oHTMLFormatOptions;

                    break;
            }


            oDestinationOptions.DiskFileName = cFileName;
            oExportOptions.ExportDestinationOptions =
                        oDestinationOptions;
            oExportOptions.ExportDestinationType =
                        ExportDestinationType.DiskFile;

            oReport.Export(oExportOptions);

        }

   }
}
Listing 2: Using the Crystal Reports library
// Step 1, create an instance of the report and typed dataset
dsTimeSheets odsTimeSheets = new dsTimeSheets();
RPT_TimeSheet oTimeSheetReport = new RPT_TimeSheet();

// run some method that populates the typed dataset

// Step 2, create an instance of the header/footer info object

ccReportInfo oReportInfo = new ccReportInfo();
oReportInfo.FtrDataSource = "Test Data Source";
oReportInfo.FtrFootNotes = "Here are my TimeSheet Footnotes";
oReportInfo.FtrRunBy = "Run by Kevin S. Goff";
oReportInfo.FtrVersion = "Version 1.01";
oReportInfo.HdrCompany = "Test Company";
oReportInfo.HdrReportTitle = "Test TimeSheet Report";
oReportInfo.HdrSubTitle1 = "Includes Labor Rates";
oReportInfo.HdrSubTitle2 = "";
oReportInfo.UserID = "KSG001";

// Step 3, create an instance of the Crystal Reports manager
ccCrystalManager oCrystalManager = new ccCrystalManager();

// Step 4, pass the header/footer object into the report,
// and then push the dataset into the report

oCrystalManager.SetReportInfo(oTimeSheetReport, oReportInfo);
oTimeSheetReport = oCrystalManager.PushReportData(dsData,
                                   oTimeSheetReport);

// At this point, I have the report 'fully loaded' - I can
// preview, print, or export - or do anything else that I might
// need to do with the report object

// To preview...
oCrystalManager.PreviewReport(oTimeSheetReport,
                                    "General Preview Screen");

// To go straight to the default printer
oCrystalManager.PrintReport(oTimeSheetReport);


// To use the printer options dialog box,and then print
ccCrystalPrintOptionForm oPrintOptionsForm =
                   new ccCrystalPrintOptionForm();
oPrintOptionsForm.ShowDialog();
if (oPrintOptionsForm.DialogResult == DialogResult.OK)
{
     oCrystalManager.lCollate =
              oPrintOptionsForm.chkCollateCopies.Checked;
     oCrystalManager.nCopies =
              Convert.ToInt32
                     (oPrintOptionsForm.spnNumPrintedCopies.Value);
     oCrystalManager.lAllPages =
              oPrintOptionsForm.optPrintAll.Checked;
     oCrystalManager.lPageRange =
              oPrintOptionsForm.optPrintRange.Checked;
     oCrystalManager.cPrinterName =
              oPrintOptionsForm.cboPrinterList.Text.ToString();

     if (oPrintOptionsForm.optPrintRange.Checked == true)  {
          oCrystalManager.nStartPage =  Convert.ToInt32
                       (oPrintOptionsForm.txtPrintStartPage.Text);

          oCrystalManager.nEndPage = Convert.ToInt32
                       (oPrintOptionsForm.txtPrintEndPage.Text);
     }
     oCrystalManager.PrintReport(oTimeSheetReport);
}


// To export to PDF
oCrystalManager.ExportReport(oTimeSheetReport, "c:\\mypdf.pdf",
                       ccCrystalManager.ExportTypes.PDF);

// To export only the first two pages to PDF
oCrystalManager.ExportReport(oTimeSheetReport, "c:\\mypdf.pdf",
                       ccCrystalManager.ExportTypes.PDF , 1, 2);
Listing 3: Running against an internal report
ReportDocument oReport =
   new CrystalDecisions.CrystalReports.Engine.ReportDocument();

oReport.Load("MyInternalReport.RPT");

// Set the run-time authentication info
// (I designed the report to directly work with a stored
// procedure, which meant
// I authenticated with the database stored proc at design time

// The report will access a different server at run time,
// so it must re-authenticate

string cServer = "MyServer";
string cDatabase = "MyDatabase";
string cUserID = "kevin";
string cPassword = "kevin7781";

// Set the connection information, and apply the login information
// for every table/result set from the stored procedure

TableLogOnInfo logOnInfo = new TableLogOnInfo();
logOnInfo = oReport.Database.Tables[0].LogOnInfo;

ConnectionInfo connectionInfo = new ConnectionInfo ();
connectionInfo = logOnInfo.ConnectionInfo;

connectionInfo.DatabaseName = cDatabase;
connectionInfo.ServerName = cServer;
connectionInfo.Password = cPassword;
connectionInfo.UserID = cUserID;

oReport.Database.Tables[0].ApplyLogOnInfo(logOnInfo);
oReport.Database.Tables[0].LogOnInfo.ConnectionInfo.DatabaseName =
     cDatabase;
oReport.Database.Tables[0].LogOnInfo.ConnectionInfo.ServerName =
     cServer;


oReport.Database.Tables[0].LogOnInfo.ConnectionInfo.UserID =
     cUserID;

oReport.Database.Tables[0].LogOnInfo.ConnectionInfo.Password =
     cPassword;


// Tricky part: I may need everything before the period character
// of the result set name

oReport.Database.Tables[0].Location =
  oReport.Database.Tables[0].Location.Substring
     (oReport.Database.Tables[0].Location.LastIndexOf(".") + 1);

myCRViewer.ReportSource = oReport;
Listing 4: Sample class for report that runs against an object
using System;
using System.Collections.Generic;
using System.Text;

namespace ReportWithClassTest
{
     public class TestReportInfo
     {
         public TestReportInfo(string cEmpName, decimal nSalary)
         {
              this.EmpName = cEmpName;
              this.Salary = nSalary;
         }

         private string _EmpName;
         public string EmpName
        {
            get { return _EmpName; }
            set { _EmpName = value; }
        }

        private decimal _Salary;
        public decimal Salary
        {
            get { return _Salary; }
            set { _Salary = value; }
        }
}
}
Listing 5: Setting a report data source to a strongly-typed custom collection
List<TestReportInfo> oList = new List<TestReportInfo>();

oList.Add(new TestReportInfo("Kevin Goff",90000));
oList.Add(new TestReportInfo("John Goff",95000));
oList.Add(new TestReportInfo("Mike Smith",99000));

CrystalReport1 oRpt = new CrystalReport1();
oRpt.SetDataSource(oList);
Table 1: Public methods for ccCrystalManager parameters are in bold.
| Method | Parameters | Description |
|---|---|---|
| PushReportData | DataSet, Report object | Pushes the DataSet into a Report object, and returns the report object |
| SetReportInfo | ccReportInfo Header/Footer object, report object | Pushes a ccReportInfo header/footer object into a report object |
| PreviewReport | Report object, title string | Launches a preview screen for a report object, and displays a preview screen title. |
| PreviewReport (Overload) | Report object, title string, Dataset | Combines PushReportData and the first overload of PreviewReport |
| PrintReport | Report object | Prints the report object, using print properties described in Table 2 |
| ExportReport | Report object, filename, ExportType object | Exports a report object to the filename, as a format described in the ExportType object (valid options are PDF, Word, and Excel) |
| ExportReport(Overload) | Report object, filename, ExportType object, start page, end page | Performs same task as the first overload, but only for a specific page range |
Table 2: Public properties for ccCrystalManager.
| Properties | Description |
|---|---|
| cPrinterName | Name of printer to use |
| nCopies | Number of copies |
| lAllPages | Sets flag to print all pages |
| lPageRange | Sets flag to print page range |
| nStartPage | If printing page range, the starting page number |
| nEndPage | If printing page range, the ending page number |
| lCollate | Sets flag to collate printed copies |
| ExportTypes | Public enumeration, items are PDF, MSWord, and MSExcel |
Table 3: Public properties for ccReportInfo.
| Properties | Description |
|---|---|
| HdrCompany | Company name, appears in the report header |
| HdrReportTitle | Report main title, appears in the report header |
| HdrSubTitle1 | Report subtitle, appears in the report header |
| HdrSubTitle2 | Second report subtitle, appears in the report header |
| FtrDataSource | Report data source, appears in the report footer |
| FtrFootNotes | Report user footnotes, appears in the report footer |
| FtrRunBy | User name of user who ran the report, appears in report footer |
| FtrVersion | Version of software, appears in report footer |
| UserID | User key of User running the report |