


When it comes to analysis and reporting, managers love Excel.
Just give them the raw data and they have a field day. For enterprise-level reporting, however, you want everybody to have the same data and the same interpretation of that data. With some effort this can be achieved without having to say goodbye to Excel.
Excel is a very powerful tool when it comes to data manipulation, analysis, and reporting. The key is that Excel holds both the raw data and the aggregations, calculations, charts, and so on. So not only can you get the big picture, you can also drill into the data. For example, if you put detailed sales data into an Excel sheet, you can calculate the revenue of your organization, a department, or single employees. You can also get information about what products sold best, the average invoice amount to a customer, and much more. It just depends how you look at the data. Due to the relative ease of use, any manager can go ahead and create his/her own report. There is no risk of corrupting the data source because Excel runs on the desktop and all data is stored locally. Also, managers can use Excel at any time and in any place, even while on a plane headed to the corporate head office.
SQL Reporting Services can provide reports in several formats including HTML, PDF and Excel.
Realistically, however, a manager will not have access to every data source and be able to get any data they desire. In addition, an enterprise needs to agree on what the data is telling them, so having every department manager create their own report isn’t very helpful, and comparing two departments is next to impossible. Still, being able to drill into the data is very useful, so you don’t want to strip away all the power Excel offers. You just need to channel its power so that everybody can agree on what the reports are saying. So how do you do this?
Harnessing the Power of Excel
You can create reports in many ways, with or without Excel. If you look only at reporting solutions that use Excel, the list roughly gets narrowed down to three:
- SQL Reporting Services
- Microsoft Visual Studio 2005 Tools for the 2007 Microsoft Office System (VSTO)
- Server-side Excel Automation
- Of course you can imagine more solutions, but in essence they will not deviate much from the above list. In this article, I’ll first look at SQL Reporting Services and VSTO to examine their plusses and minuses, and then I’ll take a detailed look at why and how you would build a server-side solution.
SQL Reporting Services
SQL Reporting Services is Microsoft’s extension on SQL Server to do reporting. It primarily goes through the Reporting Services portal, which is basically a Web application with links to the reports. You can place these reports as files in the portal or build reports on-the-fly based on some pre-defined query. In the latter case, users can modify the query with parameters defined by the report developer, such as a filter by city. This parameterization is actually very important because it enables you to break down the data into meaningful chunks by which you can compare the performance of different products, branch offices, etc. However, in order to make use of SQL Reporting Services, you need to have a connection with the server, so it’s not very helpful when you are not connected to the corporate network. You could get around this by providing the reports in different formats, such as HTML, PDF, or Excel. Users can get the data in an Excel sheet and analyze it offline. The downside is that SQL Reporting Services basically outputs tabular data, which in Excel output manifests itself as one or more sheets of data in a workbook, depending on the type of query. Unfortunately, this isn’t very useful because this is just the raw data as it is queried from the data store. Even if that data has been pre-processed for reporting purposes, it still needs to be properly formatted to have any kind of meaning on a higher level. Another problem is that Excel sheets are limited to 65,535 rows, which is potentially a limiting factor because if not all data fits in the sheet, the report may be inaccurate (which is often worse than not having a report). Filtering the data and downloading smaller chunks as you would do when you’re always connected to the server does offer a workaround, but it is not very handy. This is especially true if you’re in a field office in Africa with nothing more than a 56k modem connection. In that case, you’ll prefer a single download with all the data.
Visual Studio Tools for Office
VSTO is, in many ways, exactly the opposite of SQL Reporting Services. In a nutshell, you can use VSTO to create managed extensions on Excel that resemble macros but are much safer. That means with VSTO you can use all of the power Excel has to offer, including charting, PivotTables, and so on. PivotTables are especially nice because they offer views into the data from multiple angles. What’s more is that the underlying storage for a PivotTable, the so-called pivot cache, doesn’t suffer from the 65,535 row limit of an Excel sheet. This really opens the door for full scale reports, nicely formatted, with charts and the whole nine yards. With VSTO you can create a template that only needs to be loaded with data. When a user opens the Excel file, the user will receive a prompt to reload the data or use the file as is. When the user chooses to load the data, Excel pulls in the data from the data source. You could also have Excel aggregate the data from various sources, but that would require all users to have rights to do so. It is much easier to aggregate the data on the server using SQL Integration Services, Data Transformation Services, or similar tools. Then you can secure that one data source as needed.
If you don’t need PivotTables, you don’t need to automate Excel. There are components available to manipulate Excel files.
Using VSTO for enterprise reporting raises two major issues. First, a developer needs to build a VSTO template, whereas it’s the business intelligence folks with domain-specific knowledge that really should create the reports. With some knowledge of SQL these users should be self-sufficient. Second, a VSTO solution may not scale very well. If several users need a report, having each refresh their own file isn’t very efficient, and again this doesn’t favor the guy in the field office in Africa. Also, if you need more reports, for instance about different regions, it takes longer to process them, in which case having all this data moving over the network is even worse. You should, of course, use data compression to move the data over the network. However, that’s not something easily controlled from VSTO and could actually require a custom server application as well, making matters even more complicated.
The Server-side Solution
Doing server-side Excel Automation combines the power of VSTO with the more enterprise-oriented approach of SQL Reporting Services. You can build templates, use PivotTables, and use a centralized creation and distribution system. Server-side Excel Automation also doesn’t require the use of Visual Studio like VSTO does, so business intelligence users can create templates without development efforts, providing you give them enough flexibility to configure where the data needs to come from and where it needs to go. The fact that you are providing the plumbing and need to provide that flexibility is the hardest part of a custom solution like this. How far you need to take that depends on the needs of your organization, and as such is beyond the scope of this article, which is more about the technical issues for this solution.
Doing server-side Excel Automation combines the power of VSTO with the more enterprise-oriented approach of SQL Reporting Services.
There are multiple ways to do server-side Automation with Excel. Most don’t actually involve Excel itself but an alternative access method to an Excel file. There are several commercial components offering such services, and you can also use OLE DB to access sheet data. These methods are all thread safe, so using them in a server application is no problem. The main drawback is that none of these methods allow you to manipulate the pivot cache. As long as you stay within the 65,535 row limit, you can base a pivot on sheet data, but once you pass that mark you have no option but to install Excel on the server and automate it there. Running Excel on the server is something you shouldn’t turn to lightly, as you can read in the sidebar, Running Excel on a Server. However, in some scenarios there really isn’t much choice. In a real-world application I worked on, we had the following requirements that pushed us towards this solution:
- Reports often require PivotTables
- Analysis should be possible offline
- Efficient use of network bandwidth (many users in many countries, with sometimes limited bandwidth)
- Many different reports required, including reports for a specific country or specific person
Solution Architecture
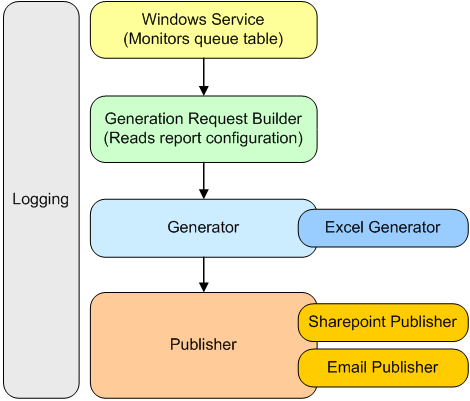
With the requirements outlined above, my team went to the drawing board (literally) and came up with an architecture that consists of two parts: data acquisition and report generation. Data acquisition meant getting the required data from the different source systems in different parts of the world and processing them to a single table format that works well with OLAP and Excel PivotTables. Depending on the data (and the location of that data) for a specific report, this could take anywhere between a few minutes and several hours. When the processing is complete, a row is added to a table with reports to be generated. After the application has added the new records, the report generation application that monitors that table starts generating reports. Figure 1 shows the basic architecture of this application implemented as a Windows Service. The architecture very much resembles the generation process, which consists of the following steps:
- Read a new work item from the queue table.
- Read the configuration for the work item.
- Create a generation request.
- Generate report for request.
- Publish generated report.
- If the configuration consists of multiple reports of the same type (for instance, one for each country), go to step 4 until all requests are done.
You can see the pluggable architecture in Figure 1. You can extend both the generation and publishing module with additional generator and publisher plug-ins. These plug-ins have to implement a specific interface. To use them you just have to change the configuration for a report. Such a configuration consists of the Excel template, generator(s), and publisher(s) to use for the report, as well as what data to load into the report, and where to put it (a sheet, a cell, or in the pivot cache). The application can parameterize what data it needs to load so that one configuration can result in multiple reports with data filtered according to the parameter. The same also applies to, for instance, the file name of the generated report and the publish location (e.g. folder), based on the same parameter. That is what a generation request is all about. It contains the actual queries, file name, publishing target, and so on, to create and publish one report file. When the generator module is called, it checks the request and loads the needed generator and passes the request on. The loaded generator then reads its configuration and processes the request, resulting in a file. That file is passed to the publisher module along with the configuration, which then loads the needed publisher or publishers if there are multiple publish targets. If needed, the publisher module compresses the file, which is a big bonus over the SQL Reporting Services or VSTO approach.
Loading the Data
The focus of this article is not how to use the Excel Automation API, but about how to use Excel on the server without getting into big trouble. However, you need to know some things about how the application loads the data and its impact. The target for the data determines how the application loads the data. If it is just a cell, the cell value is set directly as shown in Listing 1. The same would work for a sheet, but for a sheet another option is to use a query table, which is a sheet that loads data from a query. In this case, you set the connection string and the query, and then turn over control to Excel and have it load/refresh the data. With a PivotTable you have two options: either point a PivotTable to data in a sheet that you can load with the methods mentioned above or set up the underlying pivot cache. Setting up the pivot cache is similar to setting up a query table, so again you have to turn over control to Excel. Listing 2 shows you how this works in a nutshell. Both Listing 1 and Listing 2 assume that you imported the Excel namespace (Microsoft.Office.Interop.Excel). In Listing 2, a reference to the pivot cache is acquired and the properties are set. Then the workbook, the actual Excel file, is refreshed. Note that all of this, as well as the operations is Listing 1, are done in a try-catch block catching a COMException. Because you’re doing interop, this is the only exception you’ll get. Also, note that all the objects created in the method are carefully released at the end using the code in Listing 3. If you don’t do that, you run the risk of having a dangling reference because COM uses reference counting to know when it can release an object. As long as the count is greater than zero, the object remains active. When doing Excel interop, all objects count against the Excel instance that was started, and that instance will stay active if you try to shut it down when the reference count is higher than zero.
What to Do When Excel Hangs
As mentioned earlier, running Excel on the server is not ideal. One common problem is that Excel becomes unresponsive. The most likely cause for this is a pop-up window coming up in Excel or a dangling reference as explained in the previous paragraph. Since Excel is running on the server, within a context where there is no user interface, responding to the pop-up is not possible. In 99% of the cases a pop-up window means you made a configuration error so it is very important to check the configuration at run-time and log any anomalies.
Excel should be started on a different thread, or in a different AppDomain.
When Excel hangs, you somehow need to abort it. If your application handed over control to Excel, that isn’t possible. To get around this, you need to start Excel on a different thread or in a different AppDomain. Listing 4 shows you how to start another thread that does the actual Excel interaction. Basically, you start a secondary thread, and the primary thread waits for the secondary thread to finish. You set the primary thread to wait only for a certain amount of time so that it can take action if Excel hangs. When that happens, you need to do two things: terminate Excel and terminate the secondary thread. Just doing the latter will not help because Excel runs out-of-process and the thread that activated it can’t be aborted until it is in control again. To kill Excel you have to kill the process that’s running it, but only the one that was started by your application. Because the application is running on the server under a specific user account, you actually know that Excel processes with that user account as owner are associated with your application. Listing 5 shows how you can terminate those processes using that information. With the System.Management namespace you can get access to the processes running on the machine and query for the processes you’re looking for. Once Excel has been terminated, control flows back to the secondary thread, at which point that thread can be aborted.
With Excel running on a different thread you need to be aware that exceptions on that thread are not caught by the primary thread. So you need to catch any exception on the secondary thread and store it in a place where the primary thread can get to it. The last part of Listing 4 reads that exception and re-throws it on the primary thread, so upper-level logic can take the appropriate action. Note that I’ve made the distinction between fatal and non-fatal exceptions. The former terminates processing of the work item and then checks for a new work item. The latter just causes the current generation request and goes to the next one if applicable.
Maximizing Throughput
Because this is a server application you need every scrap of performance you can get. Normally that would just mean firing up multiple threads and processing multiple reports at the same time. Unfortunately, running multiple instances of Excel, or having Excel process multiple reports on one instance, is asking for trouble. And what if Excel hangs for one of those reports? You’d end up terminating all Excel instances. However, the application is sort of a pipeline because after a file is generated, it is published. Because the publishing step in no way interferes with the generation step, you can publish one file while generating another. This means you can keep the main thread occupied with generating reports while publishing files on another thread. On a multi-processor machine this would likely result in Excel running on one processor, while publishing is done on another, which is extremely efficient.
In 2007 Microsoft Office System, Excel will have a new XML-based file format that doesn’t have the 65,535 row limit on sheets.
There are multiple ways to achieve processing in parallel. You could queue the published files in a thread-safe queue and start a second thread that monitors that queue and publishes files that are placed in the queue. Or you could asynchronously start the publishing process, so control is handed back to the main thread immediately. When all files in a configuration have been generated, the main thread can wait for all publishing threads to return, as shown in Listing 6. Generation and publishing is done within the first for-loop, which is only somewhat more complex than publishing synchronously. Basically you call the Publish method asynchronously through a delegate with the following signature:
delegate void AsyncPublisher(
    Request request,
    string fileToPublish);
The IAsyncResult object that is returned from BeginInvoke is then stored so the result of the method can be retrieved after all files have been generated. At that point an array of WaitHandle objects is created to instruct the main thread to wait until all publishing threads have done their job, and then it will retrieve those results. Note that I have used the AsyncResult object from the System.Runtime.Remoting.Messaging namespace to get the delegate used to make the initial call, and that the EndInvoke method is performed inside a try-catch block just in case there was an unhandled exception in the asynchronous call. The advantage of this approach over the queue method is that it is clear where the control is, and you can easily handle exceptions that weren’t caught in the publishing process. From the developer’s perspective, this approach is only mildly more complicated than synchronous execution. With that said, the queue version is slightly more efficient because the main thread could continue to the next report configuration immediately.
Looking Forward
Automating Microsoft Office as discussed here is far from ideal, but it is your best option in some cases. 2007 Microsoft Office System does offer some interesting alternatives. For example, it features new file formats that consists of ZIP-compressed XML files. With the fabulous XML support in .NET and several free and commercial ZIP components available, you no longer need to run Excel on the server. Instead, you can manipulate the XML documents in the compressed file, so you can fill a sheet or pivot cache by extracting data and put it in the appropriate XML document inside the compressed Excel file format. This is completely thread-safe, so generating multiple reports in parallel wouldn't be such a big deal In addition, Excel 2007 raises the worksheet limit from 65,535 rows to over one million rows. The new file format probably opens the door for SQL Reporting Services extensions that can generate Excel files with PivotTables and such. In addition, Microsoft Office SharePoint Server 2007 ships with Excel services, which aims to solve the same reporting need discussed in this article.But these technologies aren't very useful until they are widespread, a problem in large organizations with a slow adoptions rate.