


An agile team needs to define the software features which have value to the business and then plan their implementation to realize this value without delay.
In this chapter, we describe how story cards help teams identify such features and explain how to properly estimate and prioritize the work associated with implementing them. This is important groundwork for Chapter 26, which presents an approach to planning Agile projects.
Working with Customer Stories
Customer stories provide a way to identify the discrete features of a software product that have value to the business. Therefore, the team can use
stories to define and plan its work as well as to provide an objective measure of its progress in delivering valuable software to the business. You
would normally expect a pair of developers to implement a story within a small number of programming episodes.
NOTE: Although customer stories originate from extreme Programming (XP), (footnote 1) they often are used in other types of Agile projects. We prefer the term customer stories (or just stories) to user stories because it avoids any possible confusion with use cases. (footnote 2)
Overview
We first introduced customer stories in Chapter 3, then we explained that they have three basic parts: card, conversation, and confirmation. (footnote 3) Figure 25-1 shows an example of the card part of a story. It contains a summary of the conversation part of the story on its face and describes the confirmation part of the story, a customer test, on its reverse side. Stories arise from brief conversations between developers and customers that happen informally during the life of the project as a result of the Stories practice. Accordingly, most of the information about the feature is not written down, so take care that you don’t just look at the card in isolation. For example, the story in Figure 25-1 summarizes a conversation between two members of
the OSPACS team: Luke (developer) and Sally (customer). At first glance, the story looks quite simple to implement, but if you could talk to Luke you would quickly discover that it actually represents a significant amount of work, for it involves accessing an external database and then matching the contents of multiple fields which are inconsistently populated in different formats; see Figure 24-4.

NOTE: The small size of the card means that it can capture only a small fraction of the issues discussed between the developer and the customer during their conversation. The specific detail is contained in tests which are subsequently written by the customer; see Section 7.
Stories Practice
The Stories practice requires the team to plan a project using cards that serve to summarize, estimate, and prioritize the work. The developer produces a story card during a brief discussion with the customer about something the business wants the software to do. The developer summarizes this conversation on the card in the form of a statement, such as “a <type of user> wants <capability> so that <business value>”. (footnote 4) He also writes the name of the story on the card, being careful to choose a name that is short and meaningful enough for the team to be able to use it during later discussions.
Soon after the card is written, the team estimates the work required to implement the story. This gives the customer a feel for the cost of implementing the story, which helps decide its priority as indicated by its position in the pile of stories awaiting implementation. At the beginning of each iteration, the team plans its work simply by removing cards from the top of this story pile until the cumulative size reaches the same level delivered in the previous iteration. In this way, the project is regularly replanned to adjust delivery targets according to the team’s actual progress and current business priorities.
Agile teams focus on the delivery of valuable features rather than the completion of tasks, which means that they can take a much simpler and more dynamic approach to planning. Consequently, team members don’t need to identify all the requirements at the start of the project and can respond more flexibly to any changes in the business environment that occur before it is completed. This gives them a significant advantage over traditional teams whose detailed planning process and reliance on formal documents generally limit them to making a more complex static plan at the start of a project. Such plans tend to be less effective than the simple dynamic plans yielded by the Stories practice in terms of delivering software that satisfies the actual business need.
NOTE: Iterations always last for a fixed period. In some projects, they last a week, but in others they may last two or even three weeks.
Generating Stories
When a customer and developer initially sit down to discuss a story, it may take only a few minutes to write out the card and decide on a suitable name. The developer may not ultimately implement the story, so there is little point in getting into specifics at this stage. It’s important to consider only those details which are necessary for estimating its size-for example, the number and complexity of business rules, the nature of the user interface, data that needs to be stored, and so forth. Whether the developer summarizes these details on the back of the story card (see Figure 25-1) or puts them in his personal notebook, he needs to put them in general terms, because as we mentioned before, the full details of a story are captured only later, when the customer test is being written.
People become proficient at producing customer stories through practice, so you should look at the examples provided in books such as Mike Cohn’s User Stories Applied (footnote 5) and then try to copy the general style. However, the INVEST acronym, coined by Bill Wake, (footnote 6) provides a useful way to remember the attributes of a good customer story and may help you avoid some of the common pitfalls:
- Independent-One story should not depend on the implementation of another so that you can prioritize them for business rather than technical reasons.
- Negotiable-Neither the customer nor the developer must use his position to dictate the terms of a story.
- Valuable-If the feature doesn’t offer any direct value or benefit to the business, why would the business want to implement it?
- Estimate-Split large stories (epics) into smaller ones and investigate the unknown issues until you can confidently estimate the time they will take to implement.
- Small-Split or rework stories until a developer can complete them within a few days. However, don’t make them so small that the coding takes minutes rather than hours.
- Testable-You must be able to test a story to ensure that there is an agreed-upon criterion for the story’s completion. This also guards against you creating stories for nonfunctional requirements such as ease of use, reliability, and so forth.
TIP: Do not be tempted to write a program for managing customer stories electronically because this loses the significant value of having physical cards to handle while discussing stories with other people.
Estimating
Estimates of stories are more reliable when they are produced by people who have some experience doing the work; therefore, estimating is done by developers. There are three common approaches to estimating the size of a story:
- Gut feel-After spending a few minutes thinking about the matter, you produce an estimate based on your experience doing similar work. Your gut feelings can be surprisingly accurate if you have the relevant skills and know the team well.
- Comparison-You compare the work to similar jobs the team has already completed to produce a relative estimate of its size. This works best when you can size the work as being a little more than job “A,” but a little less than job “B.”
- Splitting up the work-Divide a large task into a set of subtasks that you find easier to estimate by gut feel or comparison, and then sum all the estimates for these subtasks. This is a good way to handle some work that is much larger than the rest, but becomes inaccurate when you split up the work too finely.
Estimates are notoriously difficult to get right, whatever approach you use and regardless of the amount of effort you apply. Indeed, often your initial
gut feeling after ten minutes is no worse than an estimate produced after the team has spent hours splitting up the work and deliberating about suitable comparisons to other jobs.
Sizing Stories
Stories describe what features the business requires, not how developers will implement them. Therefore, when estimating the size of a story, start by considering with other developers alternative ways in which you might complete the work. The developer who initially wrote the story card should lead the discussion by describing the sorts of tests the customer envisioned, because this usually reveals a lot about the nature of the work. After five or ten minutes of discussion, the group must then try to reach a consensus about the size of the task that will lead to the most promising solution.
Although you must eventually divide a large story (epic) into smaller stories which you can implement individually within a single iteration, it is not always necessary to split up such epics initially. It is more important to keep discussions about story estimations at a high level and to concentrate on alternatives that have a significant impact on the size of the task being considered. You are not attempting to identify each part of the task, size them individually, and then produce an estimate as the sum of the parts. You are just spending five or ten minutes getting a feel for the size of the job by talking it through with your colleagues, perhaps while standing around the coffee machine. The detailed planning of the task comes much later, just before implementation, as described in Chapter 26.
TIP: When sizing a story, take the opportunity to identify any preparation which would prevent you from completing the story within a single iteration. In this way, the team can make sure it completes this work before attempting to implement it; see the section titled Task Plan, in Chapter 26.
Absolute Values versus Relative Values for Estimation
A common way to state the size of a task is to give a figure for the number of hours it might take, but this can create problems. Consider the following:
- A team of ten developers determines that the tasks comprising a project will require 360 man-weeks’ worth of work. Therefore, they predict that they will be able to complete the project in 36 weeks: 36 = 360/10. Four weeks later, the team is behind schedule: the developers have completed only 20 man-weeks’ worth of work instead of the 40 they anticipated they would have been able to complete in this time. Accordingly, they must change every man-week estimate in the project plan to correct for their slow progress, and recalculate their delivery date: 72 = (360 x 2)/10.
Putting absolute times into a project plan means that you will need to update each estimate whenever the team’s rate of progress changes. Not only does changing all these estimates take a significant amount of time, but also, after a few months, the people involved start to lose confidence in the figures because you’ve changed them so often, even though the problem is as much about identifying the correct rate of progress as it is about poor initial estimates.
Let’s consider how we could improve things by expressing size as a relative quantity instead of an absolute one:
- A team of ten developers rates the tasks comprising a project on a scale of 0 to 9, which gives them a total of 2,880 points. They expect to complete 80 points each week, and they anticipate completing the project in 36 weeks: 36 = 2,880/80. Unfortunately, a month later they have completed only 40 points’ worth of tasks. However, they don’t need to change any estimates in the project plan because their relative size is still correct. Instead, they simply change the number of points they expect to deliver each week to 40 and recalculate the delivery date: 72 = 2,880/40.
Expressing estimates as a relative quantity makes it much easier to keep the project plan up-to-date because the individual figures aren’t changing very often. In fact, the only time you need to adjust an individual task estimate is when it becomes obvious that its relative size is wrong. For example, if you estimate the creation of all dialog boxes at 1 point, but later discover that a more realistic size for such a task would be 2 points, it is appropriate to adjust all the other estimates relating to dialog box creation. What really matters is being consistent so that the size of each task is in proportion to all the others.
NOTE: The work required to alter absolute estimates makes it difficult to adjust your project plan for changes in the team’s rate of progress more than once a month. But using relative estimates you can adjust it frequently, an important consideration when planning dynamically.
Relative Estimate Scales
Most people find it easier to compare the size of things than to produce an absolute value of size. For example, an estimate that your shoes are just a bit bigger than your friend’s is likely to be more reliable than an estimate that your shoes are 10.5 inches long. However, it is important to use appropriate scales when making such comparisons. For instance, stating a collection of shoe sizes as 72, 81, 82, 69 on a scale of 1 to 100 is actually less accurate than stating them as 7, 8, 8, 7 on a scale of 1 to 10. Mike Cohn (footnote 7) has reported considerable success using the following nonlinear scale for estimating stories:
0, 1, 2, 3, 5, 8, 13, 20, 40, 100
This scale includes 0 for tasks that are too small to consider for the purposes of planning, but nevertheless need to be completed. Giving such tasks a positive score would result in a false impression of progress when it came to counting how many points had been delivered over a period. However, you can expect to complete only so many of these zero-point tasks during a period before they collectively start to become significant.
Numbers which are larger than 8 in Mike’s scale are intended for stories that are much larger than normal, which means that you will estimate most of your stories in terms of being a relative size of 1, 2, 3, 5, or 8. The use of a nonlinear series forces you to be less precise about comparisons as they get bigger so that something that is certainly bigger than 3, but definitely less than 8, becomes a 5. In an ideal world, most of your comparisons would fall as 1, 2, or 3 task points-a range which is small enough for all developers to apply consistently over the course of a project.
Task Points and Story Cost Estimation
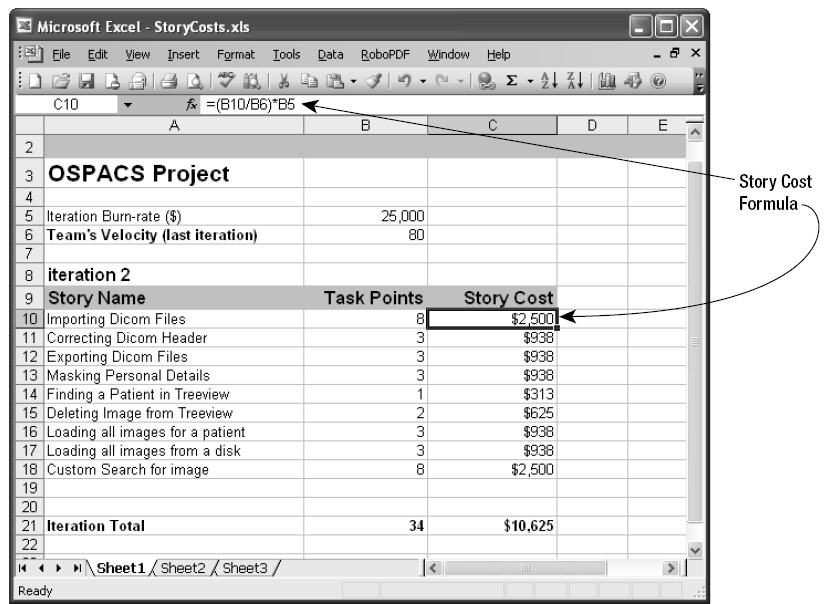
The main disadvantage of using a relative quantity for estimating is that it makes the figures more difficult to understand. This is not a problem when developers are discussing estimates among themselves, because everyone very quickly gets a feel for the difference between a 1-, 2-, and 3-point task. However, explaining such differences to people who are not involved in the estimating process can be difficult. For this reason, we suggest you convert task point estimates into story costs with the simple calculation shown in Figure 25-2, where the following terms are used:
- Task point is what developers use for estimating. It is the relative size of some work expressed on the nonlinear scale; 0, 1, 2, 3, 5, 8, 13, 20, 40, 100.
- Velocity is a measure of the team’s progress. It is the sum of the task point values for the stories successfully implemented during an iteration.
- Iteration burn rate is the cost of running the project for an iteration.
- Story cost is what customers use for budgeting. It expresses the dollar cost of implementing a story. The customer obtains this figure by dividing the sum of the story’s task points by the team’s velocity, and then multiplying by its iteration burn rate.
NOTE: The project’s burn rate doesn’t have to be the actual cost of running the project for an iteration, but you should make this figure realistic because it helps focus both customers and developers on providing good value for the money being spent.
Budgeting
It is very easy to adjust a project as a result of changes to its budget, because the total number of iterations available for the team to implement its stories depends upon the budget (price) according to the following simple formula:
- Total Number of Iterations = Total Project Price / Iteration Burn Rate
Therefore, if you had a budget of $250,000 and an average burn rate of $25,000 per iteration, the team would have ten iterations available to implement the stories, or ten weeks if you assume the iteration length is one week. Reducing this budget by $50,000 takes two iterations away from the team’s total, which will cause some of the lowest-priority stories to be canceled and will move the date of the final release forward by two iterations.
WARNING: We do not advise that you increase the budget in the hope of increasingyour team’s velocity, because as Brooks’ law (footnote 8) states, adding developers to a project that is running late only makes it later. Instead, accept the reality of your velocity and ask the customer to reprioritize.
Prioritizing
The priorities of your stories determine the order in which you should implement them. Deciding priority is primarily a job for customers, because they are ultimately responsible for deciding what should be delivered to the business and when. However, priorities also need to be set in response to technical business issues; therefore, developers must provide
some input to the process.
Value
Value starts flowing from the moment the software is released to the business, so it makes sense to prioritize stories that provide the biggest value so that this benefit can accumulate from as early as possible in the project; see Section 10. You can quantify this sort of financial value in terms of discounted cash flow, valued added analysis, and so forth, and then use the figures to set your priorities. However, you also can state value in nonfinancial terms by assessing the relative desirability of a story and the likely level of user satisfaction that might result from its implementation. You can perform this sort of analysis simply by asking a representative selection of customers (and users) to score your stories on some basis, such as the MoSCoW rules of DSDM: (footnote 9) Must have, Should have, Could have, and Won’t have. Sam Guckenheimer (footnote 10) gives a good overview of such techniques in his book, Software Engineering with Visual Studio Team System.
TIP: Ask an accountant to calculate any financial values; this will lend authority to your analysis and prevent your entire plan from being questioned because of some inappropriate financial assumption.
Business Risk
Risk from a business perspective is about the potential failure of the business to obtain the best possible value from its investment. This may happen because the software is delivered late, so the opportunity cannot be fully exploited; or it may result from the software costing more to develop than anticipated, thereby reducing the business’s profit margin. However, the most significant business risk is usually that the delivered software doesn’t meet the business’s current needs.
NOTE: Customers with a business background are usually good at managing the sorts of risks that arise from late delivery or budget overspending, so it makes sense to use these skills by giving them the means to control the project, as described in Chapter 26.
The risk of the delivered software not meeting the current needs of the business arises because of changes in the external environment or because the developers did not properly understand what they must deliver. Therefore, to manage business risks, customers need to reduce the priority of stories that are sensitive to changes in the external environment and increase the priority of stories that are somehow difficult to explain. In this way, the team delivers as late as possible any stories that are likely to be affected by external change, as this gives the environment less time to change between implementation and delivery. It also means that the team delivers any complex stories as soon as possible, so any misunderstandings can be resolved with a minimum of disruption to the flow of business value.
Technical Risk
Risk from a technical perspective concerns the possible failure of the team’s developers to fully implement the story by the required delivery date. When technical risk arises due to uncertainty among the team’s developers about how they should implement a story, it may be appropriate to increase the priority of the story. This is because the knowledge generated when you start work on a story often reduces the risk by removing some of the uncertainty about the rest of its implementation. It is better to undertake this sort of risk reduction early in the project because it gives you more time to find a technical solution and prevents you from creating a product that cannot be released because it lacks some key feature.
NOTE: The MSF for Agile process template allows you to create work items for any risks you have identified so that you can track and report them. However, on a small team, it is more convenient to write a comment on the story card to remind people about the issue.
Removing Dependencies
Clearly your customer cannot prioritize effectively on the basis of risk and value when dependencies exist between stories; for example, story Acan be done only after story B is finished. Therefore, you should avoid creating any dependencies between stories and remove any dependencies that might have been introduced before attempting to set priorities.
Typically, dependences arise when developers are estimating a story rather than when customers are formulating it. This is because during estimation, developers are thinking about implementation, so they may be tempted to split the task for a story into a sequence of subtasks and then declare some of them as being common to other stories in order to optimize
the work. When a task relates to more than one story, it creates a dependency between them, so to remove this sort of problem, you simply need to make sure each task relates to just one story and accept the fact that this may result in a certain amount of task duplication. Some of this duplication
may be removed when developers start optimizing just before implementation; see the section titled Task Plan, in Chapter 26.
NOTE: Occasionally, the estimate for a story significantly depends upon when it is done. In such cases, you need to bring the issue to the customer’s attention when the story is being prioritized, in the same way you would alert the customer of a technical risk.
One of the reasons you should avoid splitting up your work too finely is that you will start to think about optimizing work by sharing tasks among different stories and, as a result, risk creating dependencies. Therefore, the presence of dependencies between stories is often an indication that developers are going into too much detail when estimating their tasks. For this reason, many Agile teams avoid explicitly discussing tasks during estimation and instead write the size of a story directly onto the associated card in units, as “story points.” We consider it more natural for people to provide a size for something they will do (task) rather than for something they want (story), and for this reason, we prefer using the term task points.
NOTE: The traditional Agile measurement for story size is ideal days, (footnote 11) but you may find other units, such as story points, ( footnote 12) used in some projects. The name of the unit is irrelevant when you are dealing in relative values. What matters is making accurate comparisons between task sizes.
CONCLUSION
In this chapter, we identified the following key points for you to consider when creating, estimating, and prioritizing stories:
- Developers and customers develop stories together in terms of producing a card, having a conversation, and then defining a test as a form of confirmation. The acronym INVEST describes the attributes of a good story; it is independent, negotiable, valuable, capable of being estimated, small, and testable.
- Developers estimate a story by writing a value for its relative size on the card in units such as task points. In this way, you can adjust plans for changes in the rate of progress without having to change the estimate of each story. Relative estimates also tend to be more accurate.
- You should use a nonlinear scale such as 0, 1, 2, 3, 5, 8, 13, 20, 40, 100 to express size; however, most stories will lie within a small range of these values: 1, 2, or 3 task points.
- Customers prioritize stories by arranging the pile of cards awaiting implementation so that the highest-priority ones are put at the top. They set priority according to business value and risk such that the stories that provide the greatest value for the least business risk are done first.
- Developers also play a part in setting the priority of stories because technical risk needs to be addressed sooner rather than later, but technical dependencies between stories must be avoided because they inhibit the setting of business priorities.
NOTE: Proper estimates and priorities are a prerequisite for controlling any project, because feeding garbage into a planning process will inevitably result in nothing but garbage coming out.
FOOTNOTES
- Beck, Kent. Extreme Programming Explained, First Edition (Addison-Wesley, 2000).
- Jacobson, Ivar. “Object-oriented development in an industrial environment” (OOPSLA, 1987).
- Jeffries, Ron. “Essential XP: Card, Conversation, Confirmation” (www.xprogramming.com).
- [USA] Cohn, Mike. User Stories Applied (Addison-Wesley, 2004).
- [USA] Cohn, Mike. User Stories Applied (Addison-Wesley, 2004).
- Wake, Bill. “INVEST in Good Stories, and SMART Tasks” (http://xp123.com/xplor/xp0308/index.shtml).
- [AEP] Cohn, Mike. Agile Estimating and Planning (Addison-Wesley, 2006).
- [MMM] Brooks, Frederick P. The Mythical Man-Month (Addison-Wesley, 1975).
- DSDM: Dynamic Systems Development Method Web site (www.dsdm.org).
- [SETS] Guckenheimer, Sam, and Juan Perez. Software Engineering with Microsoft Visual Studio Team System (Addison-Wesley, 2006).
- Beck, Kent. Extreme Programming Explained, First Edition (Addison-Wesley, 2000).
- [AEP] Cohn, Mike. Agile Estimating and Planning (Addison-Wesley, 2006).