


Excel services is yet another important pillar in Microsoft’s business intelligence offering. Business users really like Excel because it is easy to use and they can add complex formulas to Excel to express their logic.
They can do so without involving the IT guy. The problem with this scenario, however, is that it becomes very difficult to share some Excel sheets with their coworkers. Usually users prefer to send workbooks via email, but sometimes the workbooks are too large for email, sometimes they have backend data connections, and sometimes workbooks send via email cause version confusion hell.
Excel Services solves all of these problems. In short, Excel Services allow you to publish an Excel workbook in a document library. The Excel workbook is then calculated on the server, and is then presented to one or more clients. In the calculation, Excel workbooks can involve external data sources or even custom UDFs (user defined functions) written in .NET. Once you publish the Excel workbook (though you could publish just a worksheet or even just an object like a chart), other persons, applications or services with access to the server can consume it directly through the browser by using the Excel WebApplication component, Excel Web Access Web Part, or ExcelService.asmx Web service. The Excel workbook functionality is also available over REST-based APIs and thus can be exposed as Atom feeds or JSON.
Let’s look at a practical example. Start by setting up the Northwind Traders database in a SQL server. You will find the script to set up the Northwind database in the associated code download of this article. Next I’ll craft an Excel workbook that displays orders information from this database as a pivot table and pivot chart.
Start Excel 2010 and click the Data tab in the ribbon, choose "From other sources" and choose to import data from SQL server. You have the ability to import data from various other sources as well. When prompted to import data from SQL server, choose to import the data from the orders table in the Northwind database using Windows authentication. You could have also chosen to use SQL Server authentication or to provide a secure store service ID and get credentials at runtime. Once you have finished importing the data from SQL Server, choose to save the .odc file in a SharePoint "Data Connections Library" that you will need to create beforehand.
At this point, Excel will prompt you to import the data as either a table, a pivot table, or a pivot table and pivot chart. Choose to import the data as a pivot table and pivot chart.
Now in the pivot table, make the following changes:
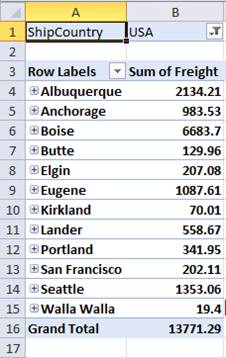
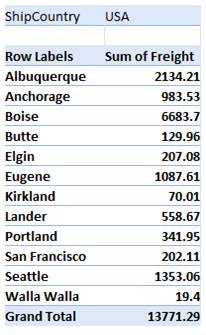
- Make ShipCountry the Report Filter.
- Make ShipCity and ShippedDate Row Labels.
- Show Sum of Values using the Freight column.
Choose to make USA as the filtered selected country. Your pivot table should look like Figure 1.
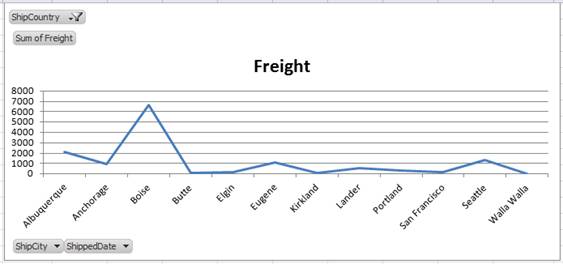
Note that the pivot chart has been updating itself and is showing you a graphical view of the data you see in the pivot table. Thus the pivot chart and pivot table are connected with each other. I’ll format the chart a bit and will choose to show a line graph instead of a bar chart (Figure 2).
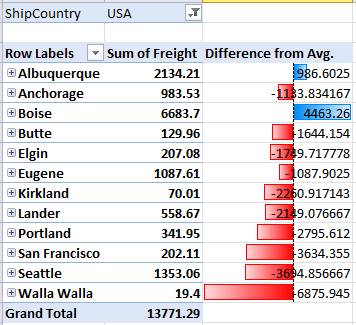
Next add a column next to the pivot table and give it a heading of "Difference from Avg.". Give it a formula of "=B4-AVERAGE(B4:B15)" and choose to repeat this formula on all available cells. Also, apply conditional formatting to this cell so it graphically shows you all cities that have freight less than or greater than average. My pivot table now looks like Figure 3.
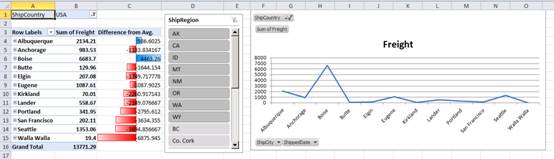
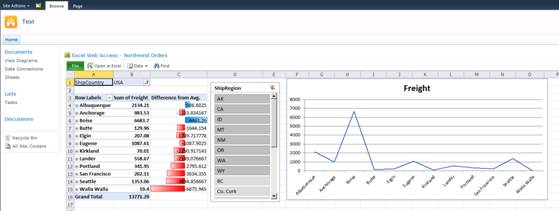
Finally, select that A1 cell in the pivot table to make the Options tab in the Ribbon visible. With the Options visible, click on Insert Slicer, and choose to make ShipRegion available in the slicer. This will allow you to slice the data at runtime and subsequently affect the pivot table and pivot chart.
You can see my final Excel sheet in Figure 4.
Now from the Backstage view of Excel 2010, click Share, and choose to publish this workbook to Excel Services. For now, publish this workbook to a document library called Sheets. You will have to pre-create this document library in your site collection. Also, you will need to pre-activate the enterprise features in your site collection. And if you have used Excel Services with SharePoint 2007, you would remember that at this point you would also have to go into Central Administration and add a trusted file location. In SharePoint 2010 this isn’t necessary because by default, all SharePoint sites are available as trusted file locations. You can verify this by going to the Central Administration | Application Management section, click Manage service applications, and choose to manage the Excel Services service. Click on Trusted file locations, and you should see an entry as shown in Figure 5.
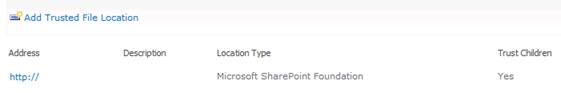
As you can guess, this entry makes the entire SharePoint farm available as a trusted file location.
With the Excel workbook published, drop the Excel Web Access Web Part on the homepage of your SharePoint site collection and configure it to show your newly published Excel workbook. You should see your Excel workbook running with full interactivity in the pivot table, pivot chart, the slicer, and showing live data from the Northwind database. You can see this in Figure 6.
Now this is a very compelling example. The end business user can craft up such workbooks talking to real data and publish them for the world to see. It gets more interesting than this. For the current web session, these workbooks can be edited in the browser and can recalculate themselves and present new data. Excel Services also have the ability to parameterize certain sheets. Also, the logic of the workbooks is exposed over a Web service and REST API. Let’s look at that next.
Accessing Excel Services Over REST
Here is the best news. The Excel workbook that you have so far been working with is already being exposed over the REST-based API. Don’t believe me? Assuming that your Excel workbook is called Northwind Orders.xlsx, visit the following URL:
http://sp2010/_vti_bin/ExcelRest.aspx/
Sheets/Northwind%20Orders.xlsx/model
As you will note, the above URL provides you with all the details embedded in your Excel workbook over an Atom feed. Now visit the following URL:
http://sp2010/_vti_bin/ExcelRest.aspx/
Sheets/Northwind%20Orders.xlsx/model/
Charts('Chart%201')?$format=image
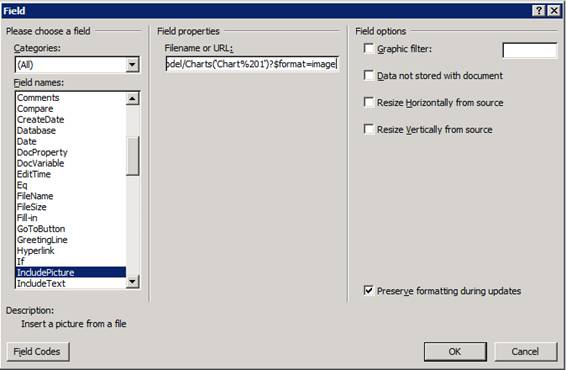
You would note that your Excel workbook chart is being exposed as a simple image. This is really useful. I’m going to show a practical demonstration of this. Imagine that your task is to craft up a document that shows the graph of the freight cost for USA. Usually what you would do is copy and paste such a chart from an existing resource and embed it in the document. That is not a perfect approach because sooner or later the chart will become out of date. You can, however, use Excel Services to create a chart that updates with live data every time the document is opened. To do so, start Word 2010, and under the Insert tab click on Quick Parts. Choose to include a new field and in the ensuing dialog box choose to "IncludePicture" and provide the appropriate URL as shown in Figure 7.
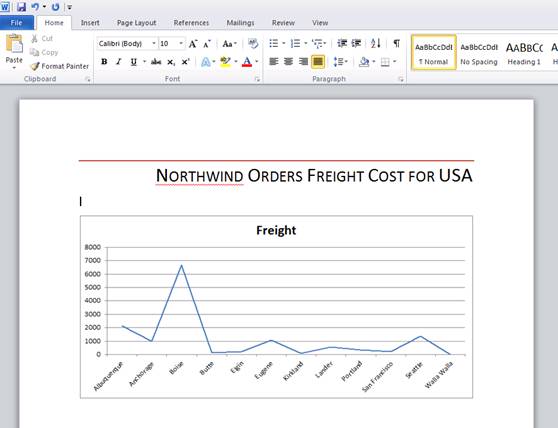
Doing so will immediately insert a chart from the Web-based URL, and every time the Word document is opened this chart will automatically be refreshed. You can see this in Figure 8.
It goes without saying that you can embed this chart in any Web-based content such as a content editor Web Part, a blog post, or even a non-SharePoint application. What is really compelling is that this functionality of Excel Services as an Atom-based feed is available on SkyDrive in the cloud as well. So you can technically host Excel workbooks in your SkyDrive and have those generate graphs that can be embedded in your blog posts.
Not only can you embed charts, you can embed any content being exposed by an Excel workbook into any other consumer. For instance, now try visiting the URL shown below:
http://sp2010/_vti_bin/ExcelRest.aspx/
Sheets/Northwind%20Orders.xlsx/model/
PivotTables('PivotTable1')?$format=html
Note the end of the query string parameter in the above URL. By default, the content is exposed as Atom feeds, but you can choose to request JSON or even HTML.
The above URLs render an HTML table as shown in Figure 9.
You can embed this HTML table into any container that can render HTML. This can be your browser, Word or Excel, or something else. For instance, to insert this content into Word again, choose to insert a Quick Part but this time, choose to insert using “IncludeText.”
Accessing Excel Services over SOAP
Just as you’re able to access Excel workbooks over REST-based APIs, they are also exposed over SOAP-based APIs. This is not very different from what was available in SharePoint 2007 as the ExcelService.asmx. The following article describes the process of using a WCF client to talk to ExcelService.asmx in SharePoint 2007, and the same technique will work in SharePoint 2010 as well.
http://blah.winsmarts.com/2008-7-Using_a_WCF_Client_to_talk_to_SharePoint_OOTB_Web_Services.aspx">http://blah.winsmarts.com/2008-7-Using_a_WCF_Client_to_talk_to_SharePoint_OOTB_Web_Services.aspx
Summary
SharePoint 2007 presented the first iteration of Excel Services. Microsoft created it in response to market demand - Excel is perhaps the most commonly used database in the world. Yes, I called it a database!
Excel Services 2010 furthers this product by introducing support for newer features in Excel 2010, and the inclusion of a REST-based API to access Excel Services 2010. This truly makes the product a lot more compelling.
Happy SharePointing.