


Every software team that takes pride in its work likes to believe that it's delivering high quality with high productivity. It's easy to say that a team is highly productive, and anyone can claim that the software he produces is of high quality. But our industry hasn't adopted clear metrics for either quality or productivity. The industry certainly has adequate research to define and report these metrics, but most software leaders either don't know about the research or haven't applied it. This article covers:
- Estimating a team's current throughput
- Tracking defect removals
- Crafting a high-quality development process
- Measuring productivity and quality
Estimating Current Productivity and Quality
With any of the major software project tracking tools, you can analyze the work as it moves through the system and gain a good understanding of the productivity and quality the team is delivering. For example, Visual Studio Team Services (my instance is at https://clearmeasure.visualstudio.com/) supports a process where work moves through various stages until the work is marked as complete.
This article uses a sample software department with anonymized data to illustrate a technique for measurement. By analyzing the historical work tracked across multiple projects, we've been able to produce results that can be very useful to software leaders charged with managing teams delivering software. As we examined the available data stored within VSTS, we conducted a quantitative analysis that can be used to estimate the productivity and quality that a software team produces.
Throughput Detection
To detect information about current throughput, we examined the movement of work through various existing stages in VSTS. We observed that although each project used differing stage (or work item status) names, we were able to map each project to a standardized set of stages and perform some conclusions that were meaningful. For example, we were able to harvest some high-level information about throughput in the software development process. Figure 1 shows a graph by project that reveals the relationship of the time spent progressing the work forward to the time spent waiting on others.
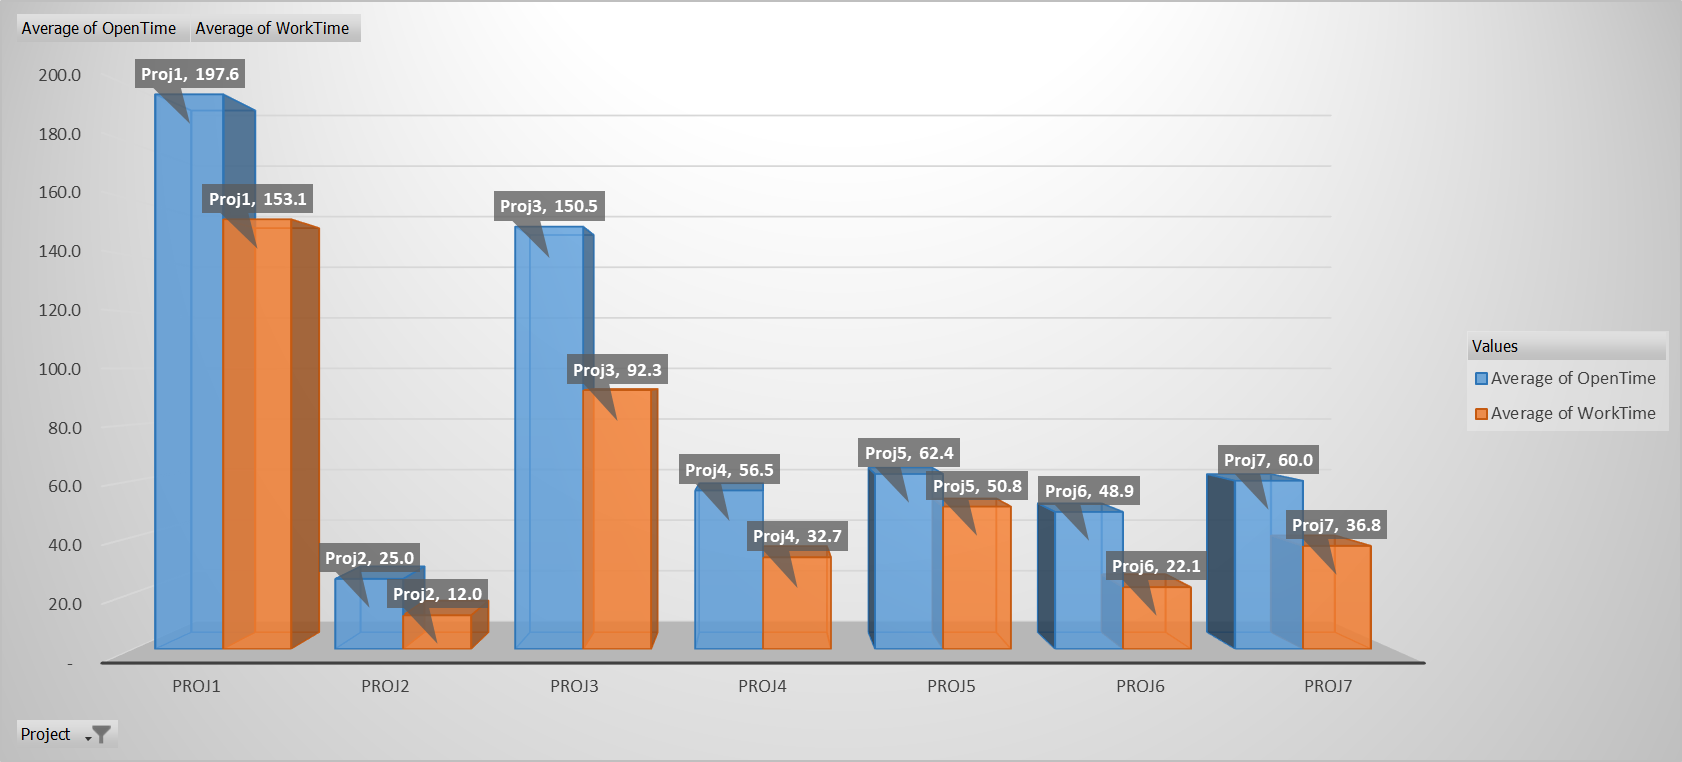
In this chart, we were able to determine the scalar average and relationship between the average lead time and the actual work time within that lead time. We found that the actual time working on an item is less than the total time the item was in the overall process. This chart breaks up these data by project. We can see the relative pace of work between projects but also that Proj6 has the greatest amount of time work is waiting for someone to work on it. When we measured this for the first time, we couldn't draw any conclusions immediately. Rather, we used it to verify that we were able to begin drawing correlations and meaningful metrics from the existing work-tracking data. This gave us confidence that when the department implements process changes, improved results can be tracked and reported easily in a similar fashion, and we will see a reduction of wait times. In addition, we inferred some process differences between projects. Consider the chart in Figure 2.
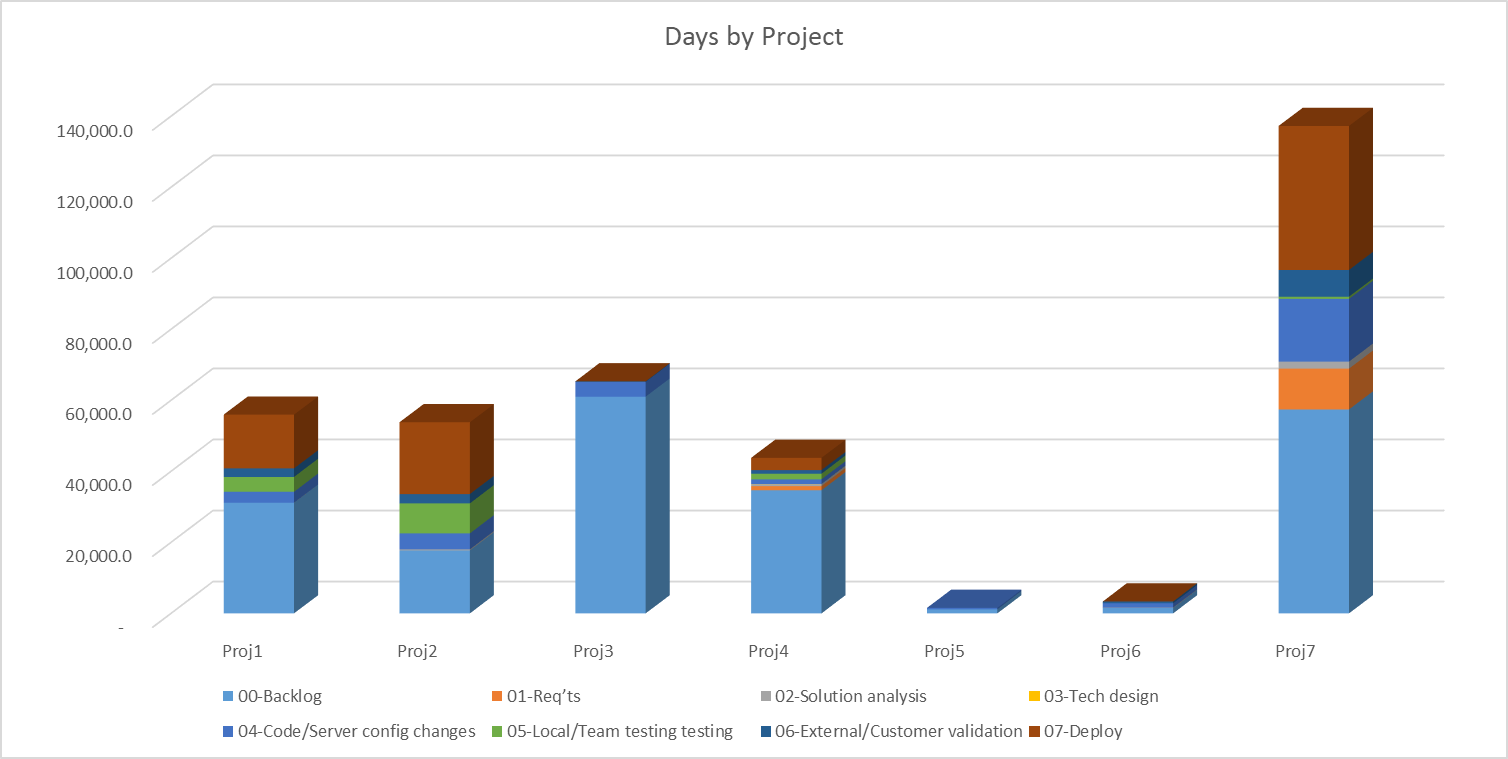
In the chart in Figure 2, we can see that some projects incurred a greater amount of work that is almost completed but waiting for release into production. For example, Proj7, Proj2, and Proj1 all had noticeably more work waiting on deployment than the other projects. In fact, Proj3 appears to deploy to production as soon as something is ready. But Proj3 also has the greatest lead time in the “backlog” stage. In other words, there's a greater percentage of items waiting to be worked at all, but once they're begun, they finish and deploy quickly. As a software leader begins to measure this type of information for the first time, he sees big differences in team and project behavior. As time progresses and various projects and teams execute with a more consistent workflow, the software leader sees the flow of work begin to look more similar.
Defect Detection
In addition to identifying information about throughput of work through the software development process, we were also able to deduce a rudimentary quantification of defects that were found during normal development. According to industry research (explained below), we know that internal software teams need to find and remove 85% of the defects that will naturally occur during software development and prevent them from being released to users in a production environment. Some defects are explicitly logged in a tracking system and are visible through reports, but in an agile process, there are also a statistically significant number of defects that are caught and corrected quickly without ever being entered as a formal defect work item in VSTS. If these aren't included, you might erroneously conclude that defect removal efficiency is below 85% because of the underestimation of defects that are removed before production. The chart in Figure 3 illustrates this finding.
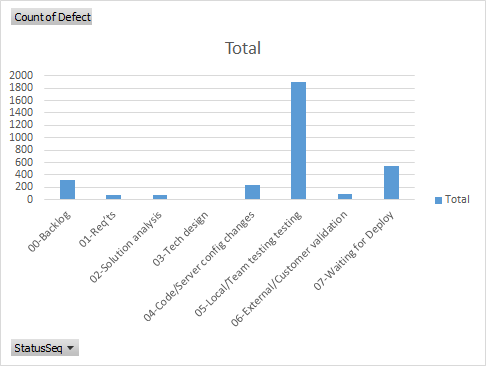
When we examine the history of each work item, we can see when the status moves backward rather than the normal movement forward toward deployment to production and being marked “done.” When the status of a work item is reset to a previous status, we can infer that there's a problem. Even though a defect might not be entered in the system, we count this as an implicit defect. This technique can accommodate agile teams that move work through to production very quickly and very often. As we can see, we have a significant number of items (stories) that move to External/Customer validation and then get bumped back to Local/Team testing because of some needed rework. It's a good outcome to catch defects in any manner possible rather than delivering them to the customer through production. And using this method, among others, we're able to quantify caught and resolved defects that would otherwise go unreported in metrics on a scorecard.
Constructing a Software Development Process
There are as many implementations of the software development lifecycle (SDLC) as there are companies that create custom software. Some companies have additional processes as necessary, but it's hard to get by without the following essential four:
- Plan: Decide what will satisfy the market and prepare to dispatch desired capabilities to personnel who can build the requested functionality.
- Build: Put ideas into released software that works properly.
- Operate: Render the services of the software to the users or customers and support them. Ensure stability of the functionality released to production.
- Maintain: Execute service schedules, break/fix, and repairs to ensure that release functionality is repaired quickly and that preventative measures are taken to prevent future breakdowns.
With these being the essential four processes of a software development function, each follows a very similar model while being very different processes.
The Shape of a Process
Once you understand the shape of a process within a software development function, you can begin to design metrics, Key Performance Indicators (KPIs), and a scorecard that can be used in a consistent way across software projects and teams. The model in Figure 4 shows the shape of a process within the software development function.
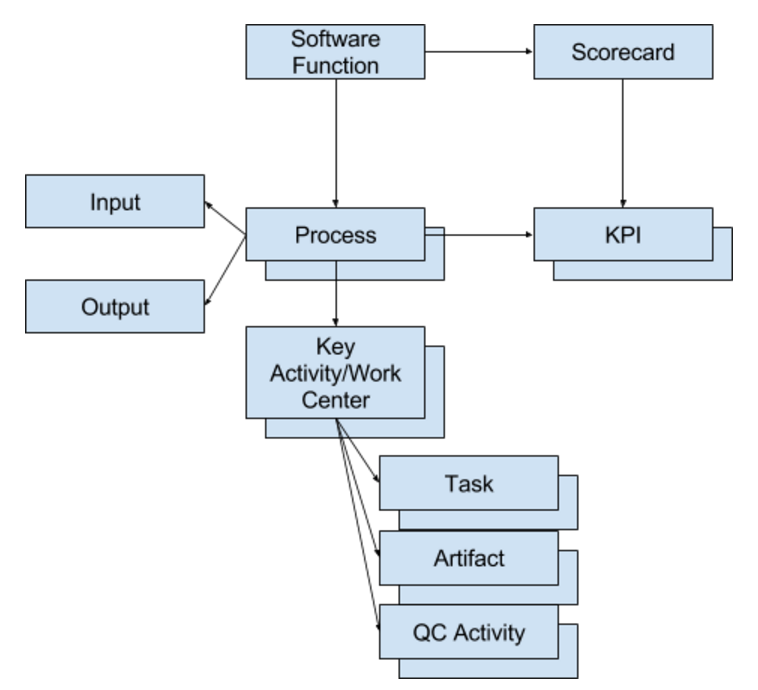
The software function has a single scorecard. The scorecard is made up of multiple KPIs, each owned by a process within the software function. Each process has an input and an output. The output is created, added to, and refined by each key activity (or work center) in the process. Each key process, in turn, has multiple tasks identified in order to produce an artifact that's added to the output of the process. Each key activity is arranged in linear order with the artifact of one serving as an input for the next. Tasks create and refine the artifact, and quality control activities identify defects to be removed before the artifact is accepted in a downstream key activity.
Principles the Process Must Implement
“The Phoenix Project,” by Gene Kim is recommended reading for anyone seeking to implement a high-performance software delivery process. In his book, Kim explains three key principles to put into play when implementing processes in a software and IT environment. Kim calls them the “three ways.”
The first principle is about the type and flow of work that flows through the process. The work must take on the following characteristics and behavior:
- Single-piece flow is ideal, but small batches are required.
- Work batches should be structured so that they can be completed as quickly as possible, leading to small work intervals.
- Defects should be caught and corrected at the source and never passed downstream in the process.
- The KPIs resulting from the work should be process KPIs and not resulting from metrics from a single key activity or work center. In other words, speed of coding is not a valid metric because it's only a piece of a process.
The second principle is about feedback loops from activities further down the process so that future defects can be prevented. Examples of this are:
- Immediately sending a piece of work back to the work center responsible for the defect.
- Creating automated quality control activities to immediately perform automated testing, inspections, and static analysis in order to catch defects quickly.
The third principle aims to create a culture of continuous improvement and mastery. For continuous improvement of the process, this principle encourages us to:
- Create improvement cycles where the team must make an improvement, even if very small.
- Take risks and experiment in order to find that next additional improvement at every cycle.
- Use time when things go wrong to flow feedback into our cycle of improvement.
Additionally, in Jez Humble's book, “Continuous Delivery,” Humble outlines eight principles and eight practices for teams that continuously deliver valuable software to customers. The eight principles are:
- The release process must be repeatable and reliable.
- Automate everything.
- If something is difficult, do it more.
- Keep everything in source control.
- “Done” means released.
- Build quality in.
- Everyone is responsible for the release process.
- Improve continuously.
The four practices are:
- Build binaries only once.
- Deploy to each environment the same way.
- Smoke test your deployment.
- If anything fails, stop the line.
Measuring the Development Process
Once a linear one-way process is assembled and executing, two aspects of the process to continually measure and optimize are:
- Quality
- Throughput
Each should be measured for actuals and forecasted for the future. In addition, these metrics can be turned into a KPI by adding a threshold, or acceptable levels:
- Poor
- Okay
- Good
The thresholds can change periodically to align with organizational goals. Industry benchmarks and available research can be used to inform the business decision about where to place thresholds.
Capers Jones has probably the most comprehensive book on software measurement and metrics available in the industry. In his book, Applied Software Measurement, he analyzes and reports on scores of software studies across languages, platforms, project types, and methodologies. In addition, in another of his books Software Engineering Best Practices, Jones reports on the 50 best software development practices and the 50 worst software development practices based solely on results from research, thereby producing a quantified listing of practices.
Quality Control
In “Software Engineering Best Practices,” Jones reports data indicating that a high-quality process can be low-throughput but that a low-quality process cannot be high-throughput. Therefore, high quality must come before high throughput, and high throughput is not achievable without high quality, most probably because as a team generates a high level of defects, much time is consumed just fixing problems that the process generates.
In addition, research indicates that three quality control activities have the best track record of helping an organization achieve 85% Defect Removal Efficiency (DRE) when combined. There are:
- Inspections
- Testing
- Static analysis
Anything done manually is more error prone and slower than its automated counterpart; therefore, you desire to implement the automated form of each quality control method if possible.
In addition to discovering and removing defects, the data from the research of Capers Jones, as well as the International Software Benchmarking Standards Group (ISBSG), indicate that teams that take measures to prevent defects end up with better overall quality and higher throughput.
The modern concept described is technical debt. Technical debt is essentially unfinished work. It can be work that was deferred to future releases or it can be defects that are marked as deferred. Technical debt can also be unmitigated risks that stay around as organizational liability. Regardless of the source, increasing the quality of a process requires technical debt to be dealt with using the following activities in priority order:
- Identify and record the debt.
- Modify the process so that technical debt is prevented in the future.
- Pay the debt down during each improvement cycle.
The final quality concern that a high-throughput process must include is how to treat non-code defects. In “Software Engineering Best Practices,” using data from Software Productivity Research and Namcook, Jones shares research that demonstrates that more defects occur before coding begins than in coding itself.
Two key metrics are critical to the measuring of quality in a software development process:
- Defect potential: The probable number of defects that will be found during the development of software applications
- Defect Removal Efficiency (DRE): Refers to the percentage of defect potentials that will be removed before the software application is delivered to its users or customers.
The above is explained in great detail by Capers Jones in his article, Measuring Defect Potentials and Defect Removal Efficiency. In fact, the research has yielded some interesting averages for both. Table 1 illustrates what you should expect on a typical business application in the United States. With the average for defect potentials being about five defects per function point, you should expect about five defects for every 52-54 lines of a high-level computer programming language.
Additional research data also reveals that formal inspections can average 65% defect removal efficiency, and testing can only identify 30-35% of defects, but when combining formal inspections with testing and automated static analysis, organizations can reliably achieve 85% defect removal efficiency.
Productivity and Throughput
Productivity, from a metrics standpoint, is a measure of how many units of work an organization pushes through its process. It can also be called throughput. Measuring throughput for a software project can be very similar to measuring throughput of a factory or manufacturing plan, and many of the same tenets of lean manufacturing can apply. In a software development process, there's one economic measure of throughput that's supported by several decades of research:
- Function points per person-month
- Useful on a per project basis
- Insufficient for closely monitoring throughput during development
Because the industry's body of productivity data is measured in Function Points or variations of function points, that's the unit available for comparing productivity across the industry. For an organization that doesn't count function points before building software, function points can be estimated by backing into it using lines of code after the software is built. Although leaving room for some inaccuracy, this practice provides a reasonably close approximation useful enough for comparison across the industry's body of research. For example, knowing that 52-54 lines of a high-level programming language are typically required to implement one function point of functionality, you can back into a function point estimate that can be used to calculate productivity per person-month.
Although this measure allows you to create an economic sampling perhaps once per quarter, you need some measures that can be sampled more frequently, even weekly. For that purpose, use the following:
- Number of features exiting the process
- Number of features in the process per team member
- Number of business days on average that a feature is in the process as well as in a stage
With these metrics, you can always know:
- Total throughput
- Work in progress at any time
- Speed of work through the process and bottlenecks
The goal is an optimal number of features exiting the process according to the ability of downstream processes to accept the work. And with the two supporting metrics, you can determine optimal staffing and lead times for work making it through the process.
Conclusion
Every software department wants to deliver quickly and deliver a quality result. With the research available in the industry, as well as the measurement techniques demonstrated in this article, software leaders can begin to measure projects. If a measurement has never taken place, the first numbers will be disappointing. But with continual process improvement, any team can achieve the removal of 85% of potential defects before production release and create a process that smoothly moves software feature requests through multiple distinct stages and on to production without bottlenecks.