


This article describes the machine learning services provided in SQL Server 2017, which support in-database use of the Python and R languages. The integration of SQL Server with open source languages popular for machine learning makes it easier to use the appropriate tool - SQL, Python, or R - for data exploration and modeling. R and Python scripts can also be used in T-SQL scripts or Integration Services packages, expanding the capabilities of ETL and database scripting.
What has this to do with stone soup, you ask? It's a metaphor, of course, but one that captures the essence of why SQL Server works so well with Python and R. To illustrate the point, I'll provide a simple walkthrough of data exploration and modeling combining SQL and Python, using a food and nutrition analysis dataset from the US Department of Agriculture.
Let's get cooking!
Machine Learning, from Craft to Pro
You might have heard that data science is more of a craft than a science. Many ingredients have to come together efficiently, to process intake data and generate models and predictions that can be consumed by business users and end customers.
However, what works well at the level of “craftsmanship” often has to change at commercial scale. Much like the home cook who has ventured out of the kitchen into a restaurant or food factory, big changes are required in the roles, ingredients, and processes. Moreover, cooking can no longer be a “one-man show;” you need the help of professionals with different specializations and their own tools to create a successful product or make the process more efficient. These specialists include data scientists, data developers and taxonomists, SQL developers, DBAS, application developers, and the domain specialists or end users who consume the results.
Any kitchen would soon be chaos if the tools used by each professional were incompatible with each other, or if processes had to be duplicated and slightly changed at each step. What restaurant would survive if carrots chopped up at one station were unusable at the next? Unfortunately, the variety (and sometimes incompatibility) of tools used in data science means that a lot of work has had to be reinvented or created ad hoc and left unmanaged. For example, ETL processes often create data slices that are too big for analysis or they change core aspects of the data irreparably.
The core business proposition of integrating Python and R with SQL and the RDBMS is to end such duplication of effort by creating commercial-strength bridges among all the tools and processes.
- Your data science tools can connect securely to the database to develop models without duplicating or compromising data.
- You can save trained models to a database and generate predictions using customer data and leave optimization to your DBA.
- You can build predictive or analytical capacity into your ETL processes using embedded R or Python scripts.
Let's look at how it works and how the integration makes it easier to combine tools as needed.
The article is targeted at the developer with an interest in machine learning (ML), who's concerned about the complexity of ML and is looking for an easier way to incorporate ML with other services and processes. I've chosen “stone soup” as a metaphor to describe the process of collaboration between data scientists and database professionals to brew up the perfectly performant ML solution.
Security Architecture
First off, let's be clear about the priorities in this platform: security, security, and security. Also, accountability, and management at scale.
Data science, like cooking, can be tremendous fun when you're experimenting in your own kitchen. Remove variables, mash data into new formats, and no one cares if the result is half-baked. But once you move into production, or use secure data, the stakes go up. You don't want someone contaminating the ingredients that go into a recipe or spying on your data and production processes. So how do you control who's allowed in the kitchen, when you can't have just anyone involved in preparing your food or touching your data?
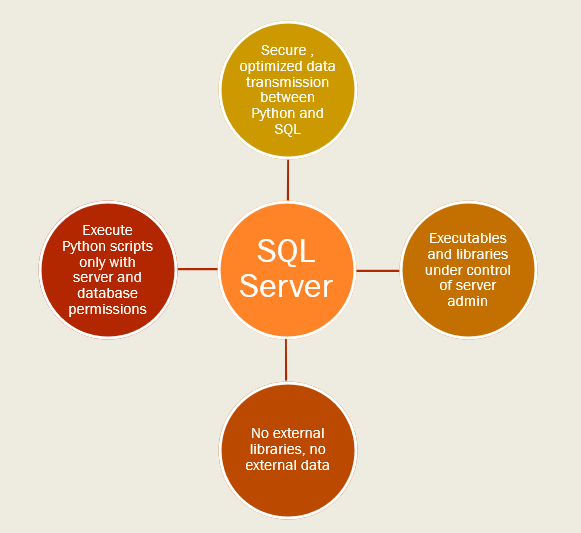
With ML in SQL Server, security and management is enforced at four layers (see Figure 1):
Isolation of Python or R processes: When you install the ML service, the database server gets its own local instance of Python (or R). Only a database administrator or someone with the appropriate permissions can run scripts or modify installed packages. (No more installing packages from the Internet on a whim.)
Secure lockdown of Python launcher: The stored procedure that calls the Python (or R) runtime is not enabled by default; after the feature has been installed, an administrator must enable external code execution at the server level, and then assign specific users the permissions to access data and run the stored procedure.
Data access: Managed by traditional SQL Server security. To get access to data, you must have database permissions, either via SQL login or Windows authentication. You can run Python or R entirely in the server context and return the results back to SQL Server tables. If you need more flexibility, data scientists with permission to connect to the database can also connect from a remote client, read data from text files stored on the local computers, and use the XDF file format to make local copies of models or intermediate data.
Internal data movement and data storage: The SQL Server process manages all connections to the server and manages hand-offs of data from the database to the Python or R processes. Data is transferred between SQL Server and the local Python (or R) process via a compressed, optimized data stream. Interim data is stored in a secure file directory accessible only by the server admin.
Whereas data science used to be a headache for control-minded DBAs, the integrated ML platform in SQL Server provides room for growth, as well as all the monitoring and management required in a commercial solution. Compare this to the old paradigm of exporting customer data to a data scientist to build a model on an unsecured laptop. Add in the SQL Server infrastructure that supports monitoring - who viewed what data, who ran which job, and for how long - infrastructure that would be complex to implement in an all-Python or R environment.
For details on the new services, and the network protocols used to exchange data between Python and SQL Server, I recommend the articles listed in Table 1 from Microsoft (end of this online article).
Now that I've touted the advantages of the platform, let's look at some of the drawbacks:
From the standpoint of the data scientist (the freewheeling home cook, if you will), the framework is far more restrictive. You can't install just any Python or R library onto the server. Some packages are incompatible with a database environment, and often the package you need isn't compatible with the version installed with the server.
Some standardization and refactoring of your Python or R code will also be required. Just as in your commercial kitchen, where vegetables have to be diced to a particular size and shape or else, your data has to match SQL's requirements. You can't dump in just any Python code, either. Code typically has to be rewritten to work inside a SQL Server stored procedure. Usually this work is trivial, such as getting tabular data from SQL Server rather than a text file and avoiding incompatible data types.
From the standpoint of the DBA, drawbacks include not just the crazy data scientists asking for Python installs, but new workloads. The administrator must allocate server resources to support ML workloads, which can have very, very different performance profiles. ML also uses new database and server roles to control script execution as well as the ability to install Python or R packages. Other new tasks for the DBA include backing up your ML data, along with your data science users and their installed libraries.
The SQL Server development team put a lot of effort into figuring out workflows that support data science without burdening the DBA too much. However, data scientists who lack familiarity with the SQL Server security model might need help to use the features effectively.
Package Installation and Management
Security is great, but the data scientist needs to be able to install open source Python or R packages. Moreover, they expect to install those new packages and all their dependencies straight from the Internet. How does this even work in a secured environment?
First off, the default installation includes the most popular packages used for data science, including nltk, scikit-learn, numpy, etc. SQL Server also supports installing new packages and sharing packages among a group of data scientists. However, the package installation process is restricted to admins and super users. This is understandable because new Python or R libraries can be a security risk. Also, if you install version x.n of a Python package, you risk breaking the work of everyone who's been using a different version of the package.
Therefore, a database administrator typically has to perform or approve the installation. You can install new packages on the server directly if an admin gives you permissions to install packages. After that, installation is as easy or hard as any other Python install, assuming the server can access the Internet. Whoops. Fortunately, there are workarounds for that too.
The SQL Server product team has thought long and hard about how to enable additional packages without breaking the database, annoying the DBA, or blocking data scientists. Package management features in SQL Server 2017 let the DBA control package permissions at the server and database level. Typically, a super user with the correct database role installs needed packages and shares them with a team. The package management features also help the DBA back-up and restore a set of Python libraries and their users. Remote installation is also supported for R packages.
Because this feature is complex, I won't provide more details here. Just know that in a secure server, there are necessarily restrictions on package installation. Table 2 lists some great resources.
Some caveats before I move on:
- Azure SQLDB uses a different method for managing packages. Because multiple databases can run in a container, stricter control is applied. For example, the SQL Server ML development team has tested and “whitelisted” R packages for compatibility and use in Azure SQL DB. At this time, the R language is the only one supported for Azure SQL DB.
- There is no comparable “whitelist” of Python packages that are safe to run on SQL Server. ML in the Linux edition of SQL Server is also still in preview. Watch the documentation for more details.
Management, Optimization, and Monitoring
If you're a database professional, you already know how to optimize server performance and have experienced the challenges of balancing multiple server workloads. For ML, you'll want to make full use of your DBA's knowledge in this area and think hard about server allocation. But you'll also need to lean hard on your data scientist.
Let's start with the basics. Calling Python (or R) does add processing time. Like any other service, you'll notice the lag the first time the executable is called, or the first time a model is loaded from a table. Successive processing is much faster, and SQL Server keeps models in cache to improve scoring performance.
If you set up some event traces, you might also detect small effects on performance from factors such as:
- Moving data, plots, or models between a remote client and the server
- Moving data between SQL Server and the Python or R executables
- Converting text or numeric data types as required by Python, R, or the RevoScale implementations
(For the nitty-gritty details of performance, I strongly recommend the blog series by SQL Server MVP Niels Berglund on Machine Learning Services internals: https://nielsberglund.com/2018/05/20/sp_execute_external_script-and-sql-compute-context—i/)
Considered as a platform, SQL Server Machine Learning offers a lot of options for optimization. Several of the most important use cases have been baked into the platform. For example, native scoring uses C++ libraries in T-SQL (https://docs.microsoft.com/sql/advanced-analytics/sql-native-scoring?view=sql-server-2017) to generate predictions from a stored model very fast. Optimized correctly, this feature can generate as many as a million predictions per second (see: One million predictions per second: https://blogs.technet.microsoft.com/machinelearning/2016/09/22/predictions-at-the-speed-of-data/).
The key phrase is “optimized correctly.” To get the super-performance goodies, you really need to know something about server configuration, SQL Server optimization, the algorithms and distributed computing features in RevoScaleR/revoscalepy, and, of course, some basic R or Python optimization. That's a tall order, and it's another reason you benefit from having multiple contributors to your stone soup.
For example, ML workloads can have very different profiles depending on whether the task is training or scoring, which algorithm has been used, and how big or wide the data is (see Figure 2: Optimization for data size vs. model complexity).
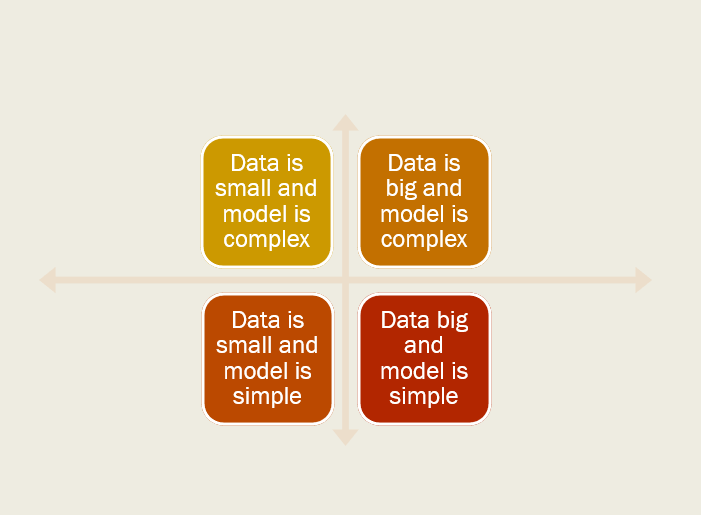
Your big data might require minimal resources if processed in parallel or by using batches, compared to a neural network model using lots of features, or even a small dataset with an algorithm that must keep the entire dataset in memory until processing is complete.
If you're curious about the performance characteristics of a particular type of model, the ML literature these days is chock-full of interesting research on which algorithm is better or faster, how much data is enough or better, and what constitutes complexity. You can even find cheat sheets specific to a type of algorithm; such as a comparison of the different implementations of decision trees or neural networks in terms of feature size, processing capacity, etc. Table 3 is a good start on these resources.
The key to success is capturing a baseline so that your DBA and your data scientist can begin the process of optimization - figuring out which processes are taking the most time, and how you can adjust your data sources and code to streamline performance. The goal here is simply to provide a set of starter resources that you can use to begin to optimize a workload in SQL Server Machine Learning.
Python and SQL: A Walkthrough
Let's get cooking! For this walkthrough, the goal is simple - to get the server and client tools set up and learn the basics of the stored procedure sp_execute_external_script.
The first two sections cover basic set up of Machine Learning Services on SQL Server, as well as set up of R or Python client tools. If you already have SQL Server 2017 installed, including the ML features, you can skip the first part.
In the third and fourth sections, I'll explore a simple data set. The data was obtained from the US Department of Food and Agriculture and represents a summary of food stamp spending across the nation.
Finally, I'll build a simple visualization using a Python package.
Prepare the Environment
For specific set up steps, see the Microsoft documentation. Links to all the pertinent set up docs are provided in Table 5, near the end of this section. Set up of the server takes about an hour and ditto for the client tools.
Choosing which features to install, and which version, is the first step. What features you install depend on what version is available, and what you will be doing with ML. Figure 3 summarizes the versions of SQL Server that support ML.
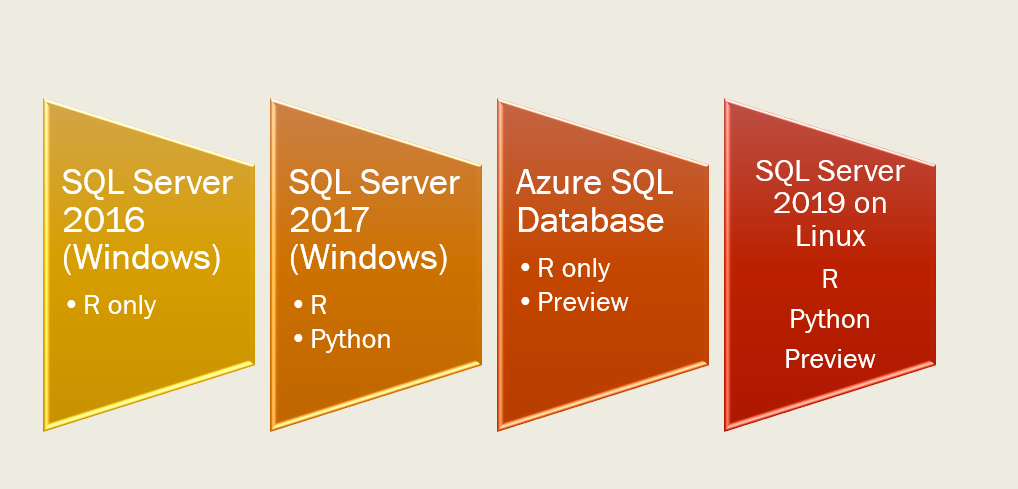
For this demo, I installed Developer Edition for SQL Server 2017, because Python became available starting in 2017.
You can use a laptop or any other personal computer with sufficient memory and processing speed, or you can create an Azure Windows VM. Remember, you need to meet at least the minimum SQL Server requirements and then have extra memory to support the Python or R workloads. Such an environment will let you try out all the features, including passing data between R and Python.
If you know that you won't be building models, only running predictions, you have many more options. You can build a model on your beefiest server, save it to a table, and then copy that model to another server or into Azure SQLDB to generate predictions.
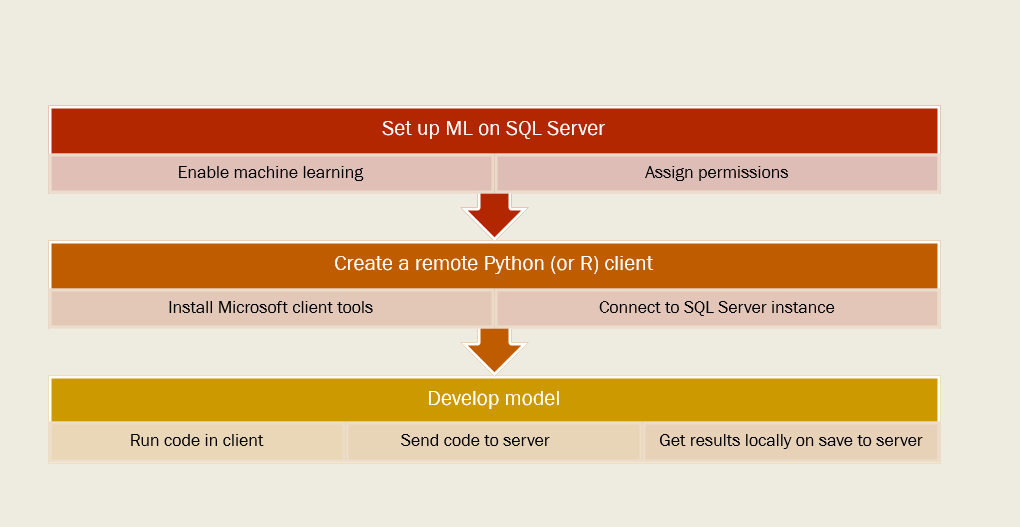
Before you begin installation, be aware that set up is a multistage process, which includes reconfiguration of SQL Server to enable the ML features, and possibly changing firewall or network protocols, followed by an optional client install, and testing of client connectivity. Figure 4 shows these stages.
Caveats:
- Be sure to choose the Machine Learning Service in SQL Server.
- Do not install the “standalone” Machine Learning Server. That's a different product, included in SQL Server set up mostly for licensing reasons. Basically, if you have an enterprise license agreement, you can install Machine Learning Server on a different computer and use that either as a development suite, or for distributed computing on Windows/Linux without SQL Server.
- After set up, do run all the connection tests suggested in the documentation. And see the troubleshooting tips listed in Table 6.
After the server is installed and ML features have been enabled, consider whether you need to install a remote client. The free client tools from Microsoft basically give you the same R or Python packages that you run on the server, to use for testing and developing solutions remotely. You must have the client to interact with SQL Server; you can't run a vanilla instance of PyCharm or RStudio.
That said, not everyone will need to set up a client, and such software might not be allowed in certain highly secured environments. If you can accept the limitations around debugging and viewing charts, you can develop and run everything in SQL Server.
However, there are good reasons to set up a client. One is that SQL Server Management Studio does not support the R graphics device and can't display charts returned from Python. If you want to view charts, find a client. For model development or data processing, it's not critical.
The download that installs the R and Python clients includes some basic tools, but not a full-fledged IDE. You might want to install an IDE or hook up an existing IDE.
- Jupyter notebook is included with the Python client install and offers support for charts.
- Spyder is included with the Python client install, but the IDE is not preconfigured to work with the
revoscalepypackages. - If you install another IDE to use as client, such as Visual Studio or PyCharm, you must create a Python environment that uses the correct libraries. Otherwise your IDE will, by default, use the Python executable named in PYTHON_PATH. Configuring this and getting it to work can be tricky. I used Visual Studio 2019, which has nice support for Python.
- The client included with the R install is much simpler to set up and configure. It's also relatively easy to run RevoScaleR from RStudio or other popular IDEs.
- If you don't have administrative rights to the SQL Server computer, connection from a remote client can be tricky. See the Troubleshooting Tips and Known Issues list (in Table 4) for current firewall and network issues.
Table 4 is a list of some resources for setting up and troubleshooting.
If you have an existing set up, take some time to verify the version of the Python (or R) executable that is used by SQL Server. You can run the following code in T-SQL (either in SSMS or a remote client like Azure Data Studio) to verify the version of Python installed on the server:
EXECUTE sp_execute_external_script
@language = N'Python',
@script = N'import sys;
print("\n".join(sys.path))'
The version of revoscalepy also must be the same on the server and any client you connect from. Run the following T-SQL code to check the revoscalepy version.
--  check Revoscalepy version
EXECUTE sp_execute_external_script
@language = N'Python',
@script = N'
import revoscalepy
import sys
print(revoscalepy.__version__)
print(sys.version)
Basic Tools and Recipes
SQL Server Machine Learning uses a stored procedure to encapsulate all Python (or R) code, as well as some related services under the covers. All interactions with the Python executables are managed by SQL Server, to guarantee data security. You call the stored procedure like you would call any other SQL command and get back tabular results. This architecture makes it easy to send data to ML, or to get back predictions: Just make a T-SQL call.
The key requirements are simple:
- Pass in a supported language as nvarchar.
- Pass in a well-formed script, as nvarchar. With Python, the “well-formed” part can be tricky, as all the rules about spaces, indents, and casing apply even in the context of the SQL design window.
- Provide inputs from SQL Server (typically as a variable, query, or view).
- Align the inputs to the variables in your Python code.
- Generate results from Python that can be passed back to SQL Server. You get one and only one tabular dataset back, as a data frame, but can return multiple other values or objects as SQL variables (models, charts, individual values, etc.).
For now, let's assume that you just want to view the data from the USDA analysis in SQL and maybe do something with it in Python. (You can use your own data, but I've provided a database backup. The dataset is quite small by SQL standards.)
The following code merges two views as inputs and returns some subset from Python.
EXECUTE sp_execute_external_script
@language = N'Python'
, @input_data_1 = N'
(SELECT * FROM [dbo].[vw_allmidwest])
UNION (SELECT * FROM [dbo].[vw_allsouth]) '
, @input_data_1_name = N'SummaryByRegion'
, @script = N'
import revoscalepy
import pandas as pd
df = pd.DataFrame(SummaryByRegion)
Midwest = df[df.Region == "midwest"]
OutputDataSet = Midwest'
WITH RESULT SETS ((col1 nvarchar(50),
col2 varchar(50), Rank1 int,
Amt1 float, Pct1 float, Rank2 int,
Amt2 float, Pct2 float))
It's not a practical example, but it demonstrates some key aspects of running Python (or R) code in SQL Server:
- The stored procedure generally takes T-SQL as input - not from a text file, console, or other ad hoc source.
- The column names from SQL aren't necessarily preserved in the output, although they're available to the Python code internally. You can change column names as part of your R or Python code.
- The default inputs and outputs are
InputDataSetandOutputDataSet. All identifiers are case-sensitive. You can optionally provide new names for the inputs and outputs. - Tabular data returned to SQL Server has to be a data frame (
pandasfor Python). Errors are generated whenever you return something that isn't a data frame, even if implicit conversion is sometimes allowed. - The Launchpad service returns error messages and other status text to the console (in SQL Server Management Studio, the Messages pane). The error messages are generally helpful although verbose.
- Providing a SQL schema for the output data is optional but can help your database developer.
A word before I go any further: SQL Server and Python are kind of like a chain saw and a food processor. Both can process huge amounts of data, but they differ in the way they chop it up. Python has lists, series, matrices, and other structures that often can be converted to a data frame, and sometimes can't. R, although it's a delightfully flexible language for data exploration, has its own quirks.
SQL Server and Python are kind of like a chain saw and a food processor. Both can process huge amounts of data, but they differ in the way they chop it up.
Such differences can break your code if you aren't aware of them or don't prepare your code to account for the differences. Be sure to review the data type conversion topics listed in Table 5, as well as the Known Issues in Books Online, before you port over existing code.
Explore Some Data
You're welcome to use Adventureworks or any existing data to play with Python. The dataset provided here is extremely simple and any similar dataset would do. For this article, I used nutritional and purchase data related to the food stamp program.
The Nutrition database (provided as a backup file) was imported from a USDA report on the supplemental nutrition assistance program, known as SNAP (or food stamps). The study analyzed food stamp purchases nationwide, and classified purchases by food and nutrition type, to try to understand if money was being well spent, and how the program might be improved.
The principal finding by the USDA was that there were no major differences in the spending patterns of households that used food assistance vs. those that do not use food assistance. For example, both types of households spend about 40 cents of every dollar of food expenditures on basic items such as meat, fruits, vegetables, milk, eggs, and bread. However, the study found some ways to improve access to healthy food choices for SNAP participants. For example, authorized retailers were required to offer a larger inventory and variety of healthy food options, and convenience-type stores were asked to stock at least seven varieties of dairy products, including plant-based alternatives.
I'll do some easy data exploration to find additional insights into food consumption by food stamp users:
- Differences between regions in terms of seasonal vegetable consumption, or meat purchases
- Top commodities for each region and for all regions
- Differences based on age of the head of household and poverty level of the surrounding community
Such descriptive statistics have long been the domain of traditional BI, and there are lots of tools for displaying nice summary charts, from Power BI to Reporting Services and plain old T-SQL, to the many graphing libraries in Python and R. Fortunately, in the SQL Server 2017 environment, you're not constrained to any one tool and can use whatever gets the job done.
I decided that it would be interesting to compare the three regions included in the report. A bar chart might work, but radar charts are also handy for displaying complex differences at a glance. A radar chart doesn't show much detail, but it does highlight the similarities, and might suggest some areas a nutritionist might want to dig into, such as the heavy use of frozen prepared foods. See Figure 5 for the summary of purchases by food type, per region.
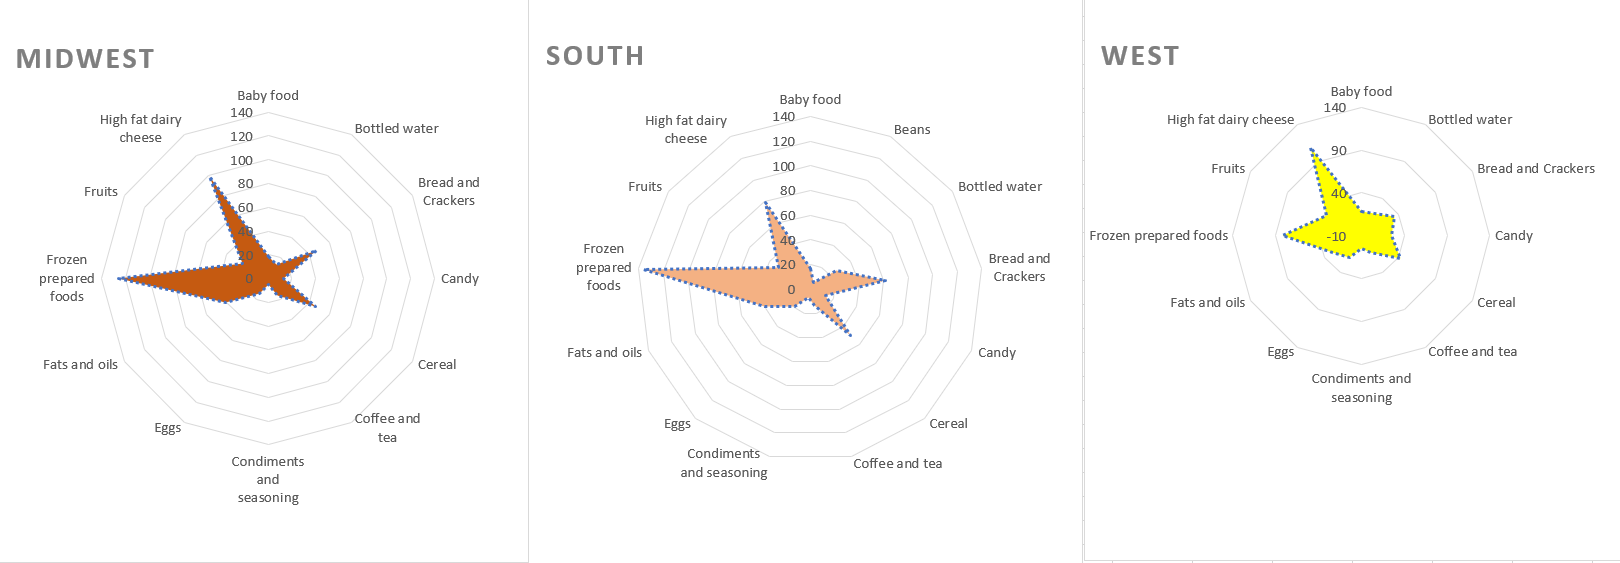
The cool graphic was produced not in Python at all, but in Excel. The Python library matplotlib includes a function for creating a radar chart, but it was pretty complex, and I'm a Python amateur, whereas creating a radar chart in Excel takes only a few clicks. That's right; I don't particularly care which tool I use, as long as I can explore the data interactively. I don't have to ask my users to learn Python or code up an interactive interface for them; the data is in SQL Server and easily accessible to existing tools that my users are familiar with.
As long as I had Excel open, I wanted to try out a new ML feature in Excel. The Ideas pane, which debuted in Office 365 in late 2018, takes any tabular data set, and computes some quick correlations on every value in every dimension in the table. Imagine how complicated that code would be if you had to write it yourself! The Ideas feature returns a series of text boxes listing the most interesting correlations.
For example, I created some quick features on the dataset that represent the delta between target groups in terms of percentage expenditures. Features were generated for poverty level in the county, the age of the head of the household, and, of course, the region (Midwest, South, and West). Analyzing the total matrix of correlations for these features took about three seconds, and Excel returned 35 different “ideas.”
The Idea presented in Figure 6 tells you that there is a bigger difference than expected between SNAP and non-SNAP households in terms of their purchases of infant formula.
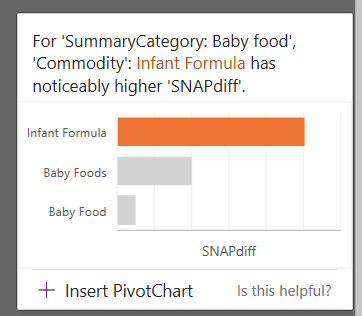
The wording is a bit opaque, and you would have to do further analysis to see exactly what this means. But in fact, this particular correlation was one of the primary findings in the original USDA study, so the results are valid.
Other “ideas” from Excel suggested that ice cream purchases were higher in southern households than in other regions, and that southern households spent more money on meat than those in the West or Midwest. What's behind those differences? Ideas is a fun, easy way to start the data exploration process.
Predictive Analytics
In the original study, the goal of analysis was to determine whether there were significant differences between consumption patterns of food stamp users vs. other consumers, and the answer was clearly negative. That's okay. We tend to expect that brilliant insights will emerge from every set of data and forget that the original goal of statistical analysis is to disprove that an effect exists.
A secondary goal was to explore areas where potentially the program could be modified to assist SNAP users or improve store offerings. There are lots of ways to do exploratory analysis and I would have loved to use one of the newer clustering methods, but the summary data was too sparse. So let's fall back on a favorite “broad qualitative method:” the word cloud.
The wordcloud package in Python makes a handy example for these reasons:
- It's not installed by default but it has very few dependencies. All those required packages are already installed.
- The method for outputting an image file is a useful one to know. Neither SSMS nor most other SQL tools (such as Azure Data Studio) can directly display graphs created by Python or R. Instead, you output the plot as a binary data stream, which you can use elsewhere. This method is important because it's also how you output a model and save it to a table for reuse.
Step 1. Install wordcloud on the server and client. The default installation of SQL Server Machine Learning includes many of the most popular packages for ML, and to try out the features, you don't need to install additional packages. To see a list of all currently installed packages, you can run something like this:
-- view packages in instance library
EXEC sp_execute_external_script
@language = N'Python',
@script = N'
import pip
import pandas as pd
installed_pkgs = pip.get_installed_distributions()
installed_pkgs_list = sorted(["%s==%s" % (i.key, i.version)
for i in installed_pkgs])
df = pd.DataFrame(installed_pkgs_list)
OutputDataSet = df'
WITH RESULT SETS ((PackageVersion nvarchar(150)))
Assuming that wordcloud isn't already present, you can install it on the SQL Server instance by opening a command prompt as administrator at the folder containing the Python scripts library, typically C:\Program Files\Microsoft SQL Server\MSSQL14.MSSQLSERVER\PYTHON_SERVICES\Scripts.
pip.exe install wordcloud
To install wordcloud on the client might require a little more work. On my computer, multiple Python environments complicated the issue to the point where I finally removed all old client tools and old Python versions and installed Visual Studio 2019 Community Edition. (Although only in preview release, it has a nice UI and some improvements in Python support.)
Ensure that the custom environment uses the downloaded Microsoft Python client, to match the Python libraries on SQL Server, and open a command prompt (not a Python interactive window) to run pip as follows:
python -m pip install wordcloud
Step 2. Prepare text data used for the word cloud. There are many ways to create and provide weights to a word cloud. To simplify the demo, I used Python to process the list of top commodities for each region and wrote that data back to a table.
Data preparation is another area where the SQL Server platform gives you the ability to use the most convenient, fastest tool for the job. This data set had very short text entries, so I merely concatenated the text and removed nulls, but you can imagine text data sources where the ability to process data in Python's nltk and return the tokenized text to SQL Server would be useful. On a later iteration, I'll probably add a stopword list or expand abbreviations.
INSERT [dbo].[WesternFoods]
EXECUTE sp_execute_external_script
  @language = N'Python', @input_data_1 = N'(SELECT Region, [Subcommodity],
  [CompositeSubcat],[OtherSubcat],[SNAP_Pct] FROM [dbo].[vw_FoodListWest])' , @script = N'
import revoscalepy
import pandas as pd
df = pd.DataFrame(InputDataSet)
# prevent Python from inserting None
df = df.fillna("")
df["mergedtext"] = df["Subcommodity"].map(str)+ " " + df["CompositeSubcat"].map(str)
print(list(df.columns.values))
OutputDataSet = df[["Region","SNAP_Pct","mergedtext"]]'
Note: There's some slight cost incurred when moving data between SQL Server and Python, but the pipeline is highly compressed and optimized; certainly, it's faster that moving data across the network to a Python client.
Step 3. Create the plot. Having extracted the table of words and weights, it's simple to input the data to sp_execute_external_script as a view or query, and build a word cloud using Python or R. The Python script has these basic steps:
- Import the required libraries.
- Put word data from the SQL query into a data frame.
- Create a word cloud using Python libraries.
- Dump the plot objects as a serialized variable using pickle.
- Save the variable as an output to SQL Server.
You can see the full text of the stored procedure in Listing 1, but this excerpt shows the key steps:
from wordcloud import WordCloud, ImageColorGenerator
# Handle and prepare datadf = pd.DataFrame(WesternFoods)descriptors = df.MergedText.valuestext =
  descriptors[0]wordcloud = WordCloud().generate(text)plot0 = pd.DataFrame(data =[pickle.dumps(wordcloud)], columns =["plot"]
Listing 1: Stored procedure that creates the Western word cloud
USE [Nutrition]
GO

/*** Object:  StoredProcedure [dbo].[mysp_Westernwordcloud] ***/
SET ANSI_NULLS ON
GO

SET QUOTED_IDENTIFIER ON
GO


CREATE PROCEDURE [dbo].[mysp_Westernwordcloud]
as
BEGIN
EXECUTE sp_execute_external_script
@language = N'Python'
, @input_data_1 = N'SELECT CAST (ROUND([Weight1] * 100, 0) as INT) as Weights, [MergedText] FROM [dbo].[WesternFoods]'
, @input_data_1_name = N'WesternFoods'
, @script = N'
import revoscalepy
import pandas as pd
import pickle
import matplotlib.pyplot as plt
from wordcloud import WordCloud, STOPWORDS, ImageColorGenerator

# Handle and prepare data
df = pd.DataFrame(WesternFoods)
descriptors = df.MergedText.values
ncounts = df.Weights.values
print(type(ncounts))

text = descriptors[0]
print(type(text))

# Generate basic plot
wordcloud = WordCloud().generate(text)

# Serialize and output to variable
plot0 = pd.DataFrame(data =[pickle.dumps(wordcloud)], columns =["plot"])
OutputDataSet = plot0
'
WITH RESULT SETS (( plot varbinary(max) ))

END
GO
The pattern of creating a complex object and saving it to a binary data stream is standard for handling complex structures like plots or predictive models. SQL Server can't understand or display them, so you generate the object, save it as a binary data stream, and then pass the variable to another SQL statement or client or save it to a table.
In the case of a predictive model, you'll generally save the model to a table. That way you can save and manage models, add metadata about when the model was run on how many rows of data, and which prediction runs it was used for. To see an example of this process for models used in production, I recommend this tutorial from the Microsoft data science team: Python for SQL developers (https://docs.microsoft.com/sql/advanced-analytics/tutorials/sqldev-py3-explore-and-visualize-the-data?view=sql-server-2017).
For plots, you need some way to view the object, and there are several options:
- Save the plot to a local image file, and then copy the file elsewhere to view it. That way, you aren't inviting people to open image files on the server.
- Save the
binaryobject to a table. - Pass the binary variable to a Python client so that it can be read and displayed.
I recommend using a Python client to view charts. Configuring the client correctly is critical. To ensure compatibility, the Python version, the revoscalepy version, and the package versions must exactly match what's installed on SQL Server.
However, the clients provided in the Microsoft download don't come preconfigured to use the right libraries; you'll need to supply the Python environment definition yourself. The documentation has guidance on the properties that need to be supplied in the environment.
Set up a Python client: https://docs.microsoft.com/sql/advanced-analytics/python/setup-python-client-tools-sql?view=sql-server-2017. You can see the dialog in Figure 7.
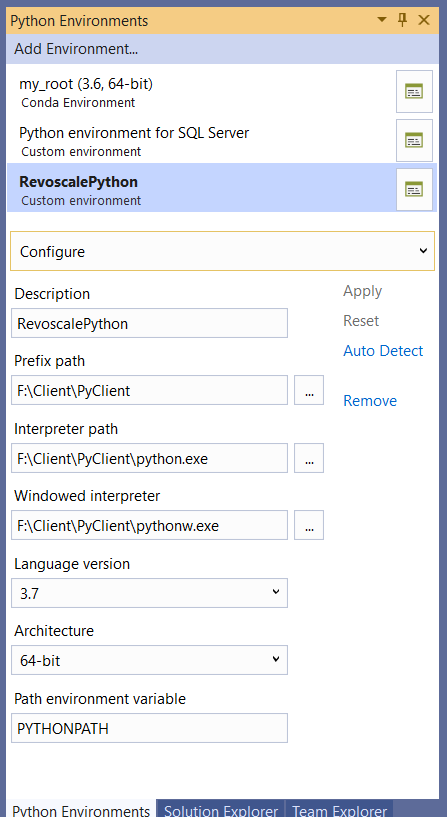
In my case, connections from several tools failed, possibly because so many old Python clients and environments were cluttering the system. After uninstalling several Python IDEs, I installed Visual Studio 2019, Community Edition, as the client, and configured a custom environment using the tips in the documentation. It worked great, and Visual Studio 2019 has improved support for Python, but other Microsoft demos have used Visual Studio 2017 and PyCharm. Let me know what works for you!
Because my client is installed on the same computer as SQL Server, I also created a custom environment that points to the server libraries, as you can see in Figure 7. Typically, you'd never run code using this environment unless you had a problem you needed to debug.
The code that loads the word cloud in the client as a plot is shown in Listing 2. I ran the code using the interactive window, which opens the plot in a separate graphics window.
Listing 2. Viewing the wordcloud from a remote Python client
import matplotlib
import pyodbc
import pickle
import os
from matplotlib import pyplot as plt
from matplotlib import rcParams
rcParams["figure.figsize"] = (10, 10)

# connect to database and get plot object
nutritiondb = pyodbc.connect('DRIVER=SQL Server;SERVER=LEGIONJ1060;DATABASE=Nutrition; Trusted_Connection=True;')
cursor = nutritiondb.cursor()
# From a stored procedure        , use the following line
# cursor.execute("EXECUTE [dbo].[mysp_Westernwordcloud]")
# From a query on table with saved plots, use this line
cursor.execute("SELECT * FROM [dbo].[pythonplots]")

# Display plot using matplotlib
tables = cursor.fetchall()
for i in range(0, len(tables)):
type(i)
WC = pickle.loads(tables[i][0])
type(WC)
plt.imshow(WC)
plt.imshow(WC)
plt.axis("off")
plt.show()
nutritiondb.close()
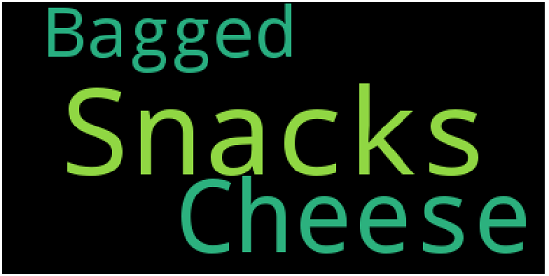
The first word cloud, in Figure 8, is much too simple, of course. I'll want to add weights, adjust font and canvas size, and tweak the colors. However, now that I have the code in a stored procedure, it's relatively easy to change the parameters and create different graphic objects. I can also clone working code to use other regional data sets and add metadata to the plots table. In short, the use of stored procedures makes it easy to build on existing code, pass in parameters, and generate metadata for storing with the plot objects.
Advanced ML Recipes for the Enterprise
I've illustrated the integration of Python and R with SQL Server using a food dataset because it was an interesting domain. However, astute readers will have noted that the dataset was extremely small and didn't really require the resources of the server. SQL Server Machine Learning can certainly be used for this type of exploration, but it's really required in scenarios where performance and handling of large data is required, such as these:
- Creating models that can be processed in parallel using
revoscalepy,RevoScaleR, ormicrosoftmlalgorithms - Saving models to a table, which you can then reuse in any server that supports native scoring
- Loading pretrained models from disk and caching for subsequent predictions
- Scaling predictions from a saved model to multiple servers
- Embedding Python or R scripts in ETL tasks, using an Execute SQL task in Integration Services
Go Pro in the Kitchen with Team Data Science
Going pro with data science is more complicated than getting bigger data or moving the data to a server from a file share. Scaling up requires fundamental changes in the way you work.
Back to the cooking metaphor, imagine a pastry chef who has crafted an elaborate French pastry. Like the data scientist who has painstakingly selected and prepared data and fine-tuned the results using feature selection and parameters, the result is a one-off masterpiece.
Now imagine that chef being asked to turn that delightful recipe into a commodity at the pace of several hundred thousand per day. The problem is no longer one of taste and invention, but of scale and process. And because a lot of money rests on the results, consistency and guaranteed results are critical, as well as accountability for preparation and cooking time and ingredient cost.
Data scientists often find themselves scrambling to efficiently productize and hand over the perfect mix of data and algorithm. Tasks include documenting what was done and why, ensuring that results are repeatable, changing the recipe as needed to support scale and cost reduction, and tracking the consistency and quality of results.
Data scientists often find themselves scrambling to efficiently productize and hand over the perfect mix of data and algorithm.
The good news is that there's help from the Team Data Science Project (TDSP). TDSP is a solution created by Microsoft data science teams to guide a team through development, iteration, and production management of a large data science project. You can read more here: https://docs.microsoft.com/azure/machine-learning/team-data-science-process/overview.
Based loosely on the CRISP-DM standard, TDSP provides a set of templates for reproducible, well-managed data mining projects. The templates apply to multiple products, not solely SQL Server, and provide a structure around key data science tasks that you can use to organize a project or communicate with a client, such as:
- Formally defining the business problem and the data required
- Defining the scope and lifecycle of the data science project. Describing the people who are required in a large data science project and their roles
- Providing to partners the detailed requirements in terms of packages, server resources, data types, data SLAs, etc.
- Specifying ownership and SLAs for related operations such as data cleansing, scoring pipelines, backups, etc.
In case you're thinking “this is all too complex for my little project,” consider how many applications have started as demo projects but ended up in production and ran for years with scant documentation. Given that data science projects typically entail massive amounts of data that change frequently, with small tweaks to algorithms that few people understand, best start documenting early!
Scaling Up = Changing Your Recipe
A core value proposition for integration of SQL Server with an open source language like Python (or R) is to increase the limited processing capacity of Python and R to consume more data, and to build models on wider data sets. Revolution Analytics did the pioneering work on scaling R to meet enterprise needs, and their acquisition by Microsoft led to the incorporation of R (and later Python) into the SQL Server platform.
Other solutions exist to support scaling ML, of course: distributed cloud computing, specialized chipsets such as FPGAs, use of GPUs, and very large VMs customized specifically to support data science. However, the SQL Server platform has the advantage of being both ubiquitous and accessible by most developers, and it offers a well-tested security model.
Here are some challenges of scaling data science and solutions in the SQL Server Machine Learning platform:
Scaling up is rarely a linear process. This applies to cooking, as well as ML. A recipe is not a formula, and a model that runs on your laptop will not magically scale to millions of rows on the server. The training time could be quadratic to the number of points, depending on the type of model and data. The problem is not just the size of the data, or even the number of input features that can blow you out of the water. Even algorithms widely known for speed and tractability with large datasets can include features that greatly increase the number of computations and thus the time your model churns in memory.
There are different ways to address computation complexity. Is the model big because it uses a lot of data, or because it's complex, with many columns and different types of features? In the first case, SQL Server Machine Learning might be the solution because it supports algorithm optimizations and parallel process that allow distributed processing. In the second case, SQL Server and Machine Learning Server offer ways to chunk and stream data, to process far more data than is possible with native R or Python. You might also collaborate with your DBA and ETL folks to ensure that the data is available for model training and that the workload can be scheduled.
Refactoring processes takes time but saves time in the long run. Functions such as data cleansing or feature engineering that were run in-line as part of the model building process now might need to be offloaded to an ETL process. Reporting and exploration are other areas where the typical workflow of the data scientist might need drastic change. For example, rather than display a chart in your Python client, push results to a table so that it can be presented in interactive reports or consuming applications.
Scoring (prediction) is a business priority. Scoring is the process of doing work with a model, of serving up predictions to users. Optimizing this process can either be a “nice to have” or a showstopper for your ML project. For example, real-time constraints on recommendation systems mean that you must provide a user with a list of “more items like this” within a second or they leave the page. Retail stores must obtain a credit score for a new customer instantly or risk losing a customer.
For this reason, SQL Server Machine Learning has placed great emphasis on scoring optimization. Models might be retrained infrequently but called often, using millions of rows of input data. Several features are provided to optimize scoring:
- Parallel processing from SQL Server
- Native scoring, in which the model “rules” are written to C, so that predictions can be generated without ever loading R or Python. Native scoring from a stored model is extremely fast and generally can make maximum use of SQL Server parallelism. Native scoring can also run in Azure SQLDB. (There are some restrictions on the type of models that support native scoring.)
- Distributed scoring, in which a model is saved to a table in another server that can run predictions with or without R/Python)
Data Science for the DBA
Want to know the secret cook in the data science kitchen? It's your DBA. They don't just slave away on your behalf, optimizing queries and preventing resource contention. They also do their own analyses, proactively finding and fending off problems and even intrusions.
To do all this, developers often have code or tools of their own running on a local SQL Server instance. However, rather than install some other tool on the server and pass data through the SQL Server security boundary, doesn't it make more sense to use the Python or R capabilities provided by Machine Learning Services? Simply by enabling the external script execution feature, the DBA gains the ability to push event logs to Python inside the SQL Server security boundary and do some cool analytics. Like, for example:
- Looking for a more sophisticated method of analyzing log data? Try clustering or sequence analysis in R or Python.
- Tired of “reinventing the wheel” in T-SQL? Put R in SQL functions to perform complex statistics on all your data.
- Need to detect patterns of intrusion or patterns of user behavior from event logs? Check out the process mining packages in R or Python.
For example, a fun use for Python/R in the database engine is to embed specialized statistical computations functions inside stored procedures. This bit of R code fits a multivariate linear regression model:
lm(y ~ x1 + x2)
If you like a challenge, you could always implement it entirely in T-SQL. But using R or Python sure is a shortcut! To see other examples of what you can do with a few lines of R, look up “R one-liners.”
For some additional ideas of how a DBA might have fun with R, I recommend this book by a long-time SQL MVP and a Microsoft PM: SQL Server 2017 Machine Learning with R: Data Exploration, Modeling and Advanced Analytics by Tomaz Kastrun and Julie Koesmarno. The book is a departure from the usual “data science”-centered discussions of Python and R and is written with the database pro in mind. It includes multiple scenarios where R is applied to typical DBA tasks.
Conclusion
My goal was to demonstrate that running Python (or R) in SQL Server is a fun, flexible, and extensible way to do machine learning. Moving from the kitchen to the factory is a true paradigm shift that requires coordination as well as innovation, and flexibility in the choice of tools and processes. Here's how the new process-oriented, scalable, commercial data science kitchen works:
- Your data scientist contributes code that has been developed and tested in Python, then optimized by the new options in revoscalepy.
- Your DBA brings to the table the ability to keep data optimized through the model training and scoring processes and guarantees security of your product.
- Your data architect is busy cooking up new ideas for using R and Python in the ETL and reporting.
Stone soup? Sure, the combination of ingredients - SQL Server plus an open source language - might seem like an odd one, but in fact they complement each other well, and the results improve with the contribution of each tool, cook, or bit of data.
Table1: Security and architecture resources
| Resource | Link |
| Introduction to the extensibility framework | https://docs.microsoft.com/en-us/sql/machine-learning/concepts/extensibility-framework?view=sql-server-2017 |
| Network protocols and how Python is called from SQL Server | https://docs.microsoft.com/sql/advanced-analytics/concepts/extension-python?view=sql-server-2017 |
| Security details at the database level | https://docs.microsoft.com/sql/advanced-analytics/concepts/security?view=sql-server-2017 |
Table 2: Package management resources
| Resource | Link |
| Package management roles | https://blogs.msdn.microsoft.com/microsoftrservertigerteam/2017/05/11/enterprise-grade-r-package-management-made-easy-in-sql-server/ |
| Using sqlmutils to install packages remotely | https://docs.microsoft.com/sql/advanced-analytics/package-management/install-additional-r-packages-on-sql-server?view=sql-server-2017 |
Table 3: Performance optimization resources
| Task | Description and link to resource |
| Optimize Windows server and SQL Server | Although this case study was originally for R, most of the tips apply to Python models as well.The experiment compares a solution before and after server optimizations such as use of NUMA and maximum parallelism. https://docs.microsoft.com/sql/advanced-analytics/r/sql-server-configuration-r-services?view=sql-server-2017 Be sure to catch this part of the series, which covers use of compression and columnstore indexes: https://docs.microsoft.com/sql/advanced-analytics/r/sql-server-r-services-performance-tuning?view=sql-server-2017 |
| Optimize for concurrent execution | The Microsoft Tiger Team captures real-world customer problems and periodically distills them into useful blogs. https://blogs.msdn.microsoft.com/microsoftrservertigerteam/2016/09/20/tips-sql-r-services-optimization-for-concurrent-execution-of-in-database-analytics-using-sp_execute_external_script/ |
| Choose models and data processing methods | There are many ways that the RevoScale platform can improve performance: enhanced numerical computation, streaming and batching, parallel algorithms, and pretrained algorithms. This guide to distributed and parallel computing provides a high-level introduction to the types of distributed computing provided by the RevoScale algorithms. https://docs.microsoft.com/machine-learning-server/r/how-to-revoscaler-distributed-computing |
| Use pretrained models | Talk about a shortcut - the pretrained models in microsoftml (for Python and R) support sentiment analysis and image recognition, two areas where it would be impossible for most users to get and use enough training data. https://docs.microsoft.com/sql/advanced-analytics/install/sql-pretrained-models-install?view=sql-server-2017 |
| Manage SQL resources | Resource Governance is an awesome feature for helping manage ML workloads, although it's available only with Enterprise Edition. https://docs.microsoft.com/sql/advanced-analytics/administration/resource-governance?view=sql-server-2017 |
| Optimize for specific high-priority tasks | As noted earlier, fast scoring is particularly important for enterprise customers. There are lots of ways to accomplish this based on whether you are using a single server or distributed servers and even a Web farm. https://docs.microsoft.com/sql/advanced-analytics/r/how-to-do-realtime-scoring?view=sql-server-2017 https://docs.microsoft.com/machine-learning-server/operationalize/concept-what-are-web-services |
Table 4: Set up and troubleshooting resources
Table 5: Known issues and data type conversion
| Resource | Description |
| https://docs.microsoft.com/sql/advanced-analytics/python/python-libraries-and-data-types?view=sql-server-2017 | Data type mismatches and other warnings for SQL to Python conversion |
| https://docs.microsoft.com/sql/advanced-analytics/r/r-libraries-and-data-types?view=sql-server-2017 | Data type mismatches and other warnings SQL to R conversion |
| https://docs.microsoft.com/sql/advanced-analytics/r-script-execution-errors?view=sql-server-2017 | Issues that apply only to R scripts |