


At last, we're able to enter the race for the Grand Prix of Web Development using a vehicle powered by C#, and by the looks of it, our vehicle runs on rocket fuel. Of course, I'm talking about Microsoft Blazor. As we've followed the path to modern Web development, we've always been chasing the taillights of frameworks powered by JavaScript, most prominently Angular, React, and Vue. On May 19, 2020, Blazor WebAssembly was finally released, and full-stack Web development with .NET received a spot on the track.
Microsoft introduced server-side Blazor back in September 2019, which allowed the community to delve into Web development using C# and .NET. Server-side Blazor executes all logic on the server and communicates with the browser through a constant SignalR connection. The programming syntax and the project structure is identical to client-side Blazor projects, but we can still point out significant differences, as well as pros and cons between the two approaches.
The Qualifying: Client-side vs. Server-side Blazor
Until the release of WebAssembly, in-browser logic had to be executed almost exclusively as JavaScript. Regardless of the setup of your back-end, a Web application without front-end JavaScript was unthinkable. Client-side Blazor challenges JavaScript's dominance in the browser and adds C# to the pool of choices. Because it's pre-compiled into WebAssembly before being downloaded into the browser, it's destined to be significantly faster than the JavaScript counterpart, especially for applications relying heavily on computations and performance. Even though it might still be early to talk about using client-side Blazor for online gaming in the browser, it certainly brings that finish line a little closer (a line that JavaScript has yet to fully cross).
In contrast to server-side Blazor, client-side Blazor has the capability to also work offline, as it doesn't require a constant connection to the back-end. However, this aspect in particular is a double-edged sword, as the download size of a single client-side Blazor component is most likely far greater than a comparable solution developed in JavaScript or server-side Blazor. In order to run Blazor client-side, you have to download the entire runtime for the Web application, which your compiled Web project will then execute on. That means that even an empty site, or the typical “Hello World” project, will already amass to several megabytes in download size. Additionally, this also has an impact on non-standard browsers. Although most browsers are perfectly capable of dealing with WebAssembly, some niche or embedded browsers might not be and thus won't be able to load a website built on client-side Blazor technology. In that case, server-side Blazor is still an option, as the client only receives standard HTML and JavaScript from the server.
I'm not going to spend much more time on the characteristics of a Blazor application, the set-up, its ecosystem, or its architecture, as CODE Magazine has already published two articles that outline exactly that (Re-Assembling the Web with Web Assembly and Blazor by Rick Strahl, issue September/October 2018; and A New Era of Productivity with Blazor by Ed Charbonneau, CODE Focus Issue November 2019. Although some of the code snippets/syntax and namespaces might have changed with the newer releases of .NET Core, the fundamental ideas and architectural designs around Blazor have remained the same. Therefore, I still consider these articles a valid resource for information. What I want to highlight in this article is something I'm still not able to find a lot of information or examples on: Real world applications that go beyond the tutorials and typical starter apps people develop to play around with and write about. In light of the current global situation revolving around the COVID-19 pandemic, I figured that I can write an application that enables the tracking of COVID-19 statistics, and that allows me to compare different countries side by side, including graphs. I'll show how to set up the project and make service calls to REST APIs for data acquisition. I'll also demonstrate that a client-side Blazor application can easily be converted into a server-side Blazor application. Both the client-side and server-side version of the Blazor sample project are already published on Microsoft Azure and publicly available (links at the end of the article and in a sidebar).
The Race to a Real-World Example
Start off by creating a new Blazor project in Visual Studio 2019 (Note: VS2017 doesn't support client-side Blazor projects). It's imperative to ensure that you also have the most current version of .NET Core SDK (3.1.301, as of time of writing) installed. You will be prompted to choose between a Blazor Server App and a Blazor WebAssembly App - I chose the latter (Figure 1).
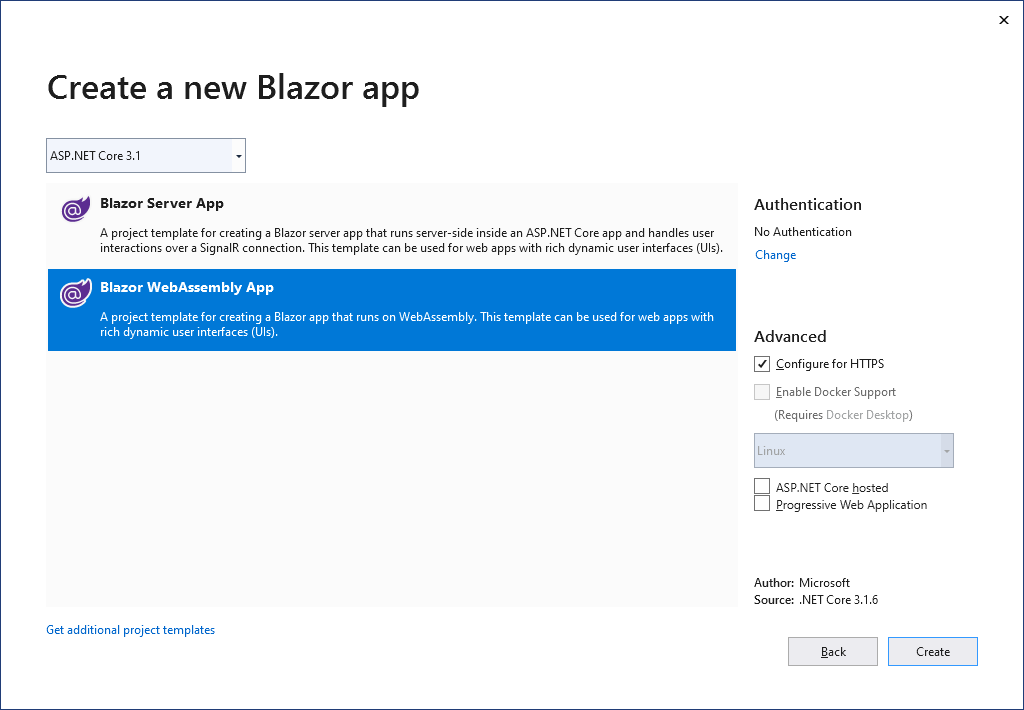
Visual Studio sets up the project for you and gives a starting point, which should be quite familiar to everyone who's experimented with Blazor before, be it client-side or server-side. You can see three default Razor components in the Pages folder: Index, Counter, and FetchData. If you compile and run the application, your browser shows the familiar sample application that Microsoft put together, which is the same for client-side and server-side Blazor projects. This very example is already in one of our previous Blazor articles, so I won't repeat that discussion.
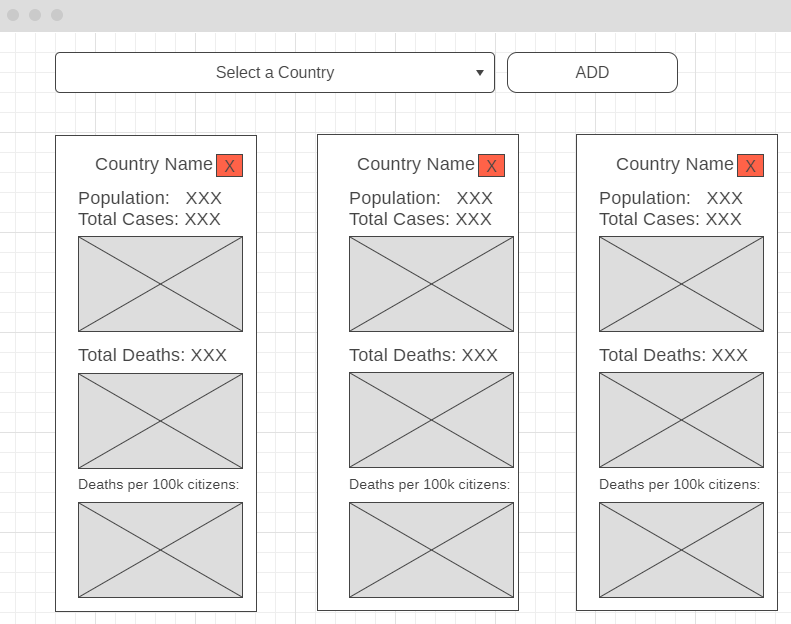
Today, I have one goal: A page displaying COVID-19 data and graphs, with direct country comparison capabilities. Start by creating a new component in the Pages folder, and name it Covid.razor. (Note: Components MUST start with a capital letter). Reference the new page in the navigation menu, found in the NavMenu component inside the Shared folder. Run the application and you should see a link to the new component in the navigation bar. It's still blank of course, but you're about to change that. The concept or mock-up can be described as follows: You want to be able to select a country, add it to a direct comparison list, and display all selected countries as columns with information about their COVID-19 cases. You also want graphs, as illustrated in Figure 2.
Before you get started, you also need to answer two important questions:
- Where are you getting your data from?
- What library are you using to display the graphs?
You have several options to choose among the freely available APIs for data acquisition. The ones I'm using for this example are:
- API for lists of countries and COVID-19 data: https://api.covid19api.com
- API for population data of individual countries: https://restcountries.eu
- API for USA data specifically: https://covidtracking.com
The reason to use a separate service for USA data specifically is based on the circumstance that the first mentioned API will return the data broken up into individual states/territories for countries big enough to justify such data separation. Although for most countries these individual data responses are easily combined, for the USA with its 50 states, it takes much longer to do so, and thus using a single service call with a different end point to retrieve USA data alone is justified.
The graphs are provided by a DevExpress Blazor component. After registration on the DevExpress website, add the DevExpress.Blazor NuGet package to the project, which includes the necessary dependencies. The DevExpress components setup is slightly different between a client-side and a server-side Blazor project. Please refer to the official DevExpress GitHub page for detailed information.
Building the General Layout
You're now ready to create the COVID-19 comparison component. Start off adding a combo box and a button to the top of the components Razor Page, each hooked up with an event: a change event for the combo box, and a click event for the button:
<select class="form-control" @onchange="SelectedCountryChanged">
    <option value="">-- Select Country --</option>
    @foreach (var country in _countries)
    {
        <option value="@country.code">@country.name</option>
    }
</select>
<button @onclick="AddDataSet">Add</button>
Populate the combo box with the data acquired from a service call to one of the APIs mentioned earlier. In order for this data to be initially available, make this service call as soon as the page is initialized. Override the OnInitializedAsync method within the @code segment of our component as shown in Listing 1.
Listing 1: Overriding the OnInitializedAsync method
protected override async Task OnInitializedAsync()
{
    CountryDatasets = new List<ParallelCountryInformation>();
    _countries = new List<ComboCountry>();
    var url = APIUrls.GetCountryList();
    var jsonCountries = await  new Client(new NewtonsoftSerializationAdapter(), baseUri: new Uri(url)).GetAsync<List<APICountry>>();
    foreach (var c in jsonCountries.Body)
    {
        _countries.Add(new ComboCountry{
        code = c.ISO2, name = c.Country });
    }
    _countries = (from c in _countries orderby c.name ascending select c).ToList();
}
Note: The static class called APIUrls provides all the necessary URL addresses for the service calls, so you don't have to repeat or copy/paste them everywhere you need them. You also need to make sure that you have the necessary @using and @inject statements at the top of the Razor Page, so that you have access to classes like Client. Additionally, initialize the CountryDatasets variable here, which is a list of ParallelCountryInformation objects that holds all the countries' information necessary for comparison.
The SelectedCountryChanged event simply sets the _selectedCountry property to the parameter passed in as ChangeEventArgs. The AddDataSet click event of the button kicks off all the logic to load COVID-19 related data and puts them into the right format for the charts to display. Let's take a peek at this process next:
According to the mock-up, you have to provide the following information for each country to display:
- Country Name
- Population
- Total COVID-19 cases
- Total COVID-19 deaths
- COVID-19 deaths per 100k citizens (a normalized value that is suited to directly comparing countries of different sizes)
The Heavy Lifting
As a first step in the AddDataSet function, make the API call to retrieve population data (see Listing 2).
Listing 2: REST API call to load country population data
private async void AddDataSet(MouseEventArgs e)
{
    var countryToAdd = new ParallelCountryInformation();
    var url = APIUrls.GetCountryPopulationDataUrl();
    url = url.Replace("*", _selectedCountry);

    var popJsonResponse = await new Client(new NewtonsoftSerializationAdapter(), baseUri: new Uri(url)).GetAsync<ParallelCountryInformation>();

    countryToAdd.Name = popJsonResponse.Body.Name;
    countryToAdd.Population = popJsonResponse.Body.Population;
}
Note: The static class APIUrls provides the URL to make a REST API call. The returned URL string has a placeholder symbol '*', which you replace with the selected country from the combo box, for instance:
var url = APIUrls.GetCountryPopulationDataUrl();
This function call is serviced by:
public static string GetCountryPopulationDataUrl()
{
    return "https://restcountries.eu/rest/v2/alpha/*";
}
Next, you need to acquire COVID-19-related information for the selected country. You do this with another API call (and a different one if the USA had been selected – as explained earlier). One parameter in the REST API URL indicates whether you want confirmed cases or death cases. Because you need both, perform the call twice per country, as shown in Listing 3.
Listing 3: REST API calls to load COVID-19 data
var covidUrl = APIUrls.GetCountryDailyCases();
var selectedCountryToAdd = countryToAdd.Name;

var confirmedCovidUrl = covidUrl.Replace("*", selectedCountryToAdd);
confirmedCovidUrl = confirmedCovidUrl.Replace("#", "confirmed");

var deathCovidUrl = covidUrl.Replace("*", selectedCountryToAdd);
deathCovidUrl = deathCovidUrl.Replace("#", "deaths");

var jsonCountriesConfirmed = await new Client(new NewtonsoftSerializationAdapter(), baseUri: new Uri(confirmedCovidUrl)).GetAsync<List<RestCountry>>();

var timeStepCollectionConfirmed = new List<CovidTimeStep>();
var timeStepCollectionDeath = new List<CovidTimeStep>();
Naturally, the response is in JSON format and includes records such as this one:
{
  "Country":"Austria",
  "CountryCode":"AT",
  "Province":"",
  "City":"",
  "CityCode":"",
  "Lat":"47.52","Lon":"14.55",
  "Cases":18165,
  "Status":"confirmed",
  "Date":"2020-07-04T00:00:00Z"
}
The class RestCountry reflects these properties (although you don't really need some information that's returned, such as the Lon and Lat values).
Each ParallelCountryInformation object in the list of countries you want to compare has three lists of CovidTimeStep objects. These time steps are used to populate the charts.
foreach (var c in jsonCountriesConfirmed.Body )
{
    var timestep = new CovidTimeStep()
    {
        Cases = Int32.Parse(c.Cases),
        Country = c.Country,
        CountryCode = c.CountryCode,
        Date = Convert.ToDateTime(c.Date),
        Province = c.Province,
        Status = c.Status
    };
    timeStepCollectionConfirmed.Add(timestep);
}
The reason you keep the Province attribute is to distinguish responses that contain data for the country as a whole from responses that contain that same data but broken up into different states or provinces. For instance, Australia returns data separately for New South Wales, Victoria, Queensland, Western Australia, South Australia, Tasmania, Australian Capital Territory, and Northern Territory. In this case, loop over all entries in the response data that share a common date and combine them.
In order to provide the time steps for the normalized graph (cases per 100k citizens), you don't need to make additional API calls. You already know the country's population, as well as the recorded COVID-19 cases. So you create another List of CovidTimeStep objects, perform the normalization, and add the list to the object created for comparison. This whole process is shown in Listing 4.
Listing 4: Normalization of COVID-19 death cases per 100k citizens
var timeStepCollectionDeathPer100k = new List<CovidTimeStep>();
foreach (var step in countryToAdd.DeathTimeSteps)
{
    var timestepdeathper100k = new CovidTimeStep()
    {
        Country = step.Country,
        CountryCode = step.CountryCode,
        Date = step.Date,
        Status = "deathper100k"
    };

    BigInteger cases = new BigInteger(step.Cases);
    BigInteger casesDividend = BigInteger.Multiply(cases, new BigInteger(100000));

    BigInteger casesPer100k = BigInteger.Divide(casesDividend, new BigInteger(Convert.ToInt32(countryToAdd.Population)));

    timestepdeathper100k.Cases = Convert.ToInt32(casesPer100k.ToString());

    timeStepCollectionDeathPer100k.Add(timestepdeathper100k);
}
Note: Use BigInteger to perform the normalization, as these multiplications typically exceed the maximum value available for integer numbers.
Once the ParallelCountryInformation object has been provided with all the information you want to be displayed, add it to CountryDatasets and notify the component that its state has changed (which causes a re-render).
CountryDatasets.Add(countryToAdd);
this.StateHasChanged();
You're now all set with data objects. You have the capability to select a country, load relevant data, and offer it to any consuming component that can work with it.
For the proposed layout, choose a simple horizontal layout of columns, each of which represents one country. Accomplish that with a css class selector that you apply to a <div>:
.arrange-horizontally > * {
    display: inline-block;
    text-align: center;
Iterate over the collection of countries that had been added to CountryDatasets. The properties country.Name, country.Population and country.ConfirmedCases refer to parameters on the ParallelCountryInformation objects and can be addressed directly from within a <span>. The DevExpress chart component is called DxChart, and is set up using various mostly self-explanatory parameters, as seen in Listing 5. You can decide which series type you want the DxChart to use. I've chosen the DxChartLineSeries, but could exchange that to any other series type supported by this DevExpress component, such as DxChartBarSeries or DxChartAreaSeries.
Listing 5: Displaying the country information and graphs as columns within the component
<div class="arrange-horizontally">
    @foreach (var country in CountryDatasets)
    {
    <div style="width: 350px">
        <span>@country.Name </span>
        <button @onclick="@(() => RemoveColumn(country.Name))" style="width: 60px; height: 20px; color: red; font-size: x-small">Remove</button>
        <br />

        <span><b>Population:</b> @country.Population </span>
        <br />

        <span><b>Total Cases: </b>@country.ConfirmedCases</span>
        <br />

        <div>
            <DxChart Data="@country.ConfirmedTimeSteps">
                <DxChartCommonSeries AggregationMethod="@(i => (int)i.Average())" NameField="@((CovidTimeStep c) => "")" ArgumentField="@(i => i.Date.ToString("MM/dd"))" ValueField="@((CovidTimeStep i) => i.Cases)">
                    <SeriesTemplate Context="settings">
                        <DxChartLineSeries Settings="@settings" Color="@(getColorForCountry("confirmed"))"></DxChartLineSeries>
                    </SeriesTemplate>
                </DxChartCommonSeries>
            </DxChart>
        </div>
        @*...same approach for death cases & norm. death cases*@
    </div>
    }
</div>
You're also deciding dynamically which color you want your charts to use. For that purpose, call the function getColorForCountry, which returns separate colors for confirmed cases and death cases.
Because it was in the mock-up, I also added a remove button in each column to remove it from the comparison. This works by simply passing the country's name to a RemoveColumn function, which then removes the corresponding data set from the CountryDatasets list.
The Final Lap: Compiled, Displayed, Published
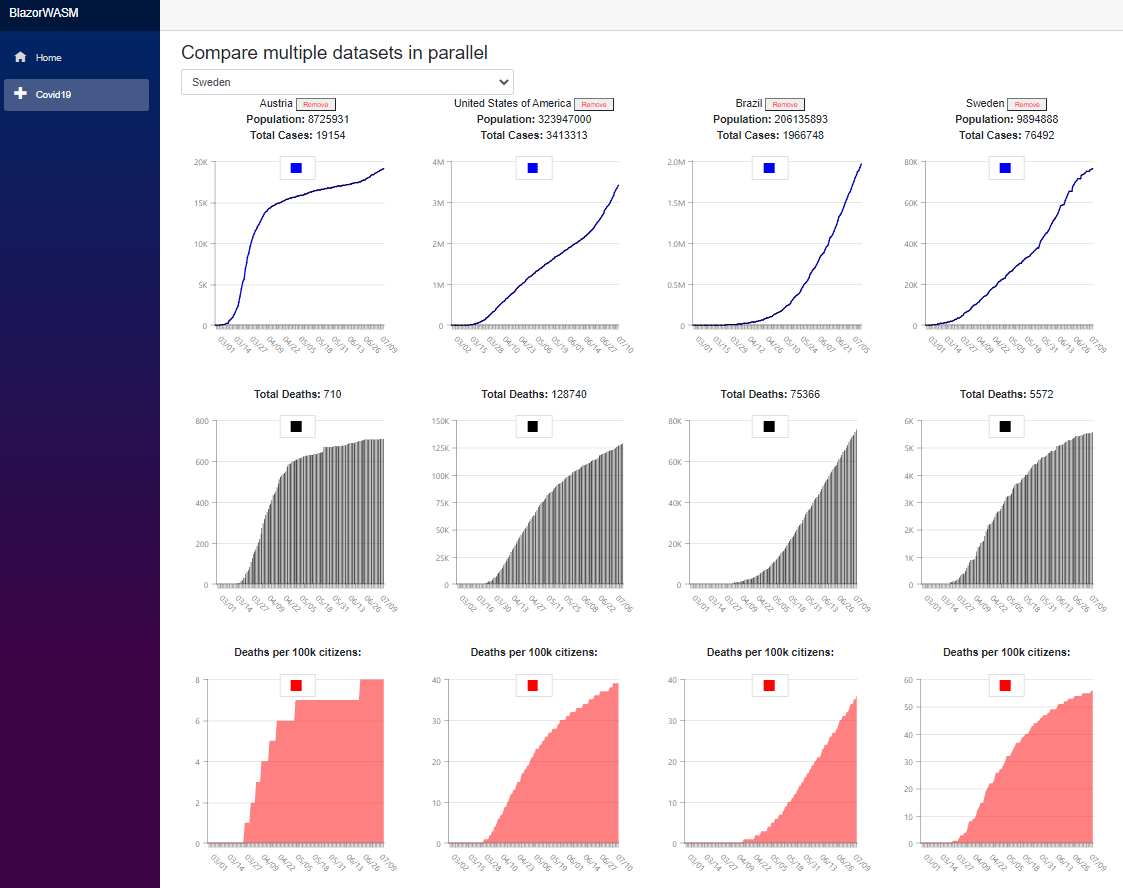
You can run the client-side Blazor application and add several countries to directly compare some of their COVID-19 related data by simply pressing F5, as shown in Figure 3.
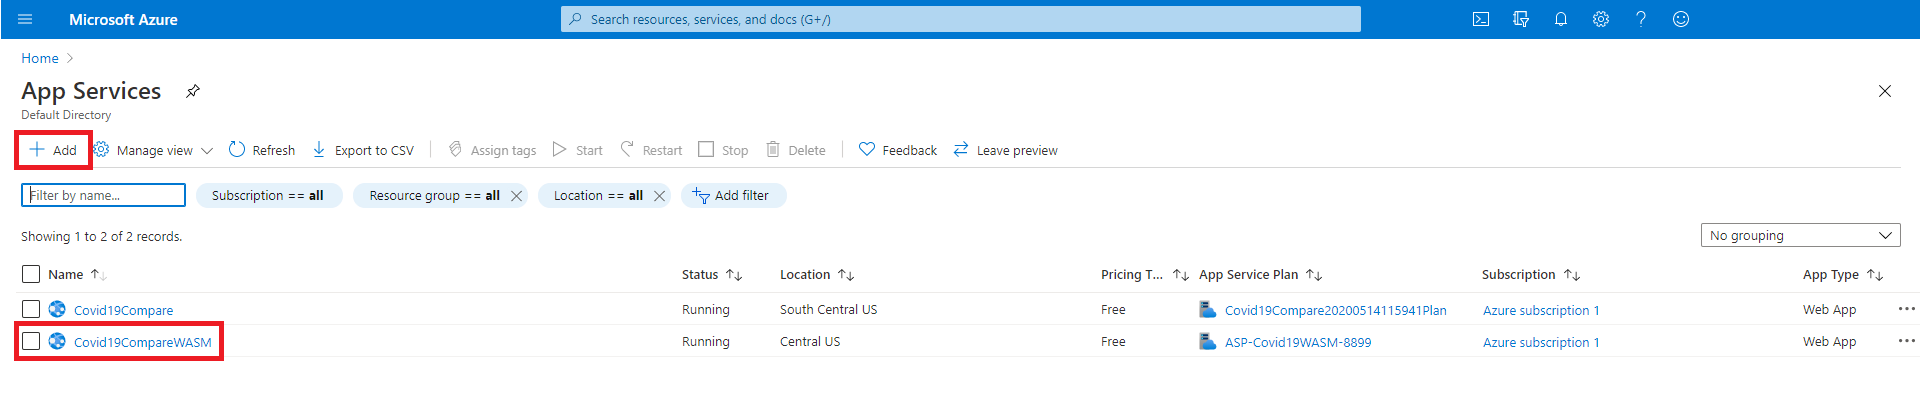
The process to publish your app on Microsoft Azure is incredibly simple and well-integrated. First, set up a new App Service as a new Azure Resource. I named it Covid19CompareWASM (as shown in Figure 4).
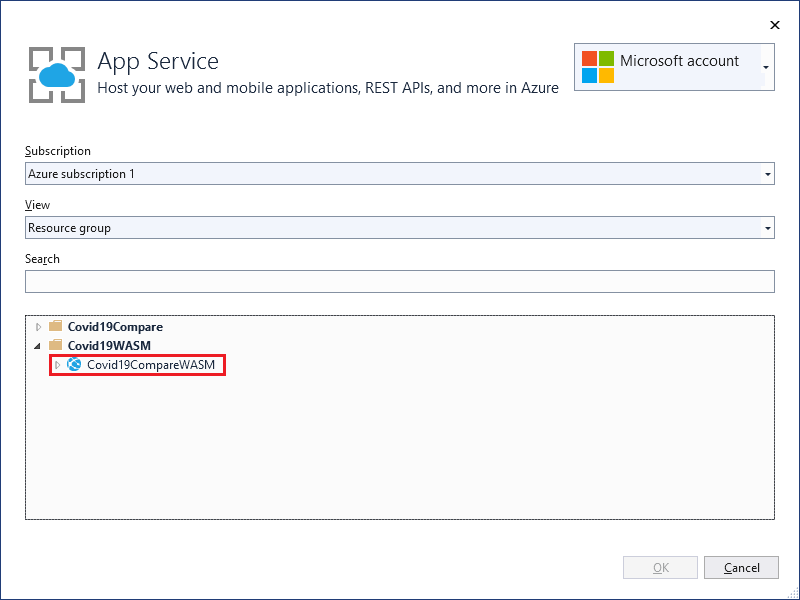
Next, go through the publish dialogue of the client-side Blazor project. When asked, select to publish to an existing resource (you could also set up a new one during this dialogue, but for the purpose of streamlining the publication process, I like to have one set up and ready at this point). You're prompted to select an Azure App Service to publish to. When logged in with the same account used on the MS Azure Portal site, you can see the resource you just created a few moments earlier in the list of choices (Figure 5).
Now the publishing setup is complete and any subsequent deployment is only one click away. The public URL that the application is published to can also be found on the publishing view within Visual Studio (Figure 6).
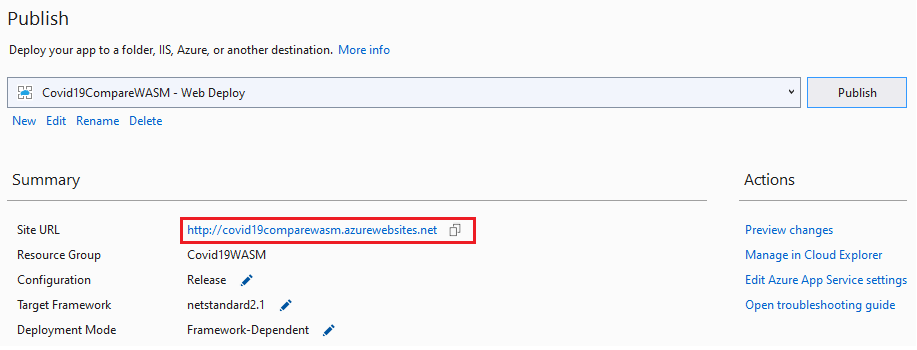
I've hosted the client-side Blazor app on Azure and it's publicly available at: http://covid19comparewasm.azurewebsites.net/.
In order to emphasize how easy it is to port between client-side and server-side Blazor applications, I've also hosted an identical but server-side Blazor version of this application at: https://covid19compare.azurewebsites.net/parallel.
The only code-wise difference between the two versions is the setup required by the DevExpress component, which is outlined in their setup instructions on GitHub. Other than that, all user-created .cs, .css, and .razor files in are identical in both projects. There are no differences in the deployment process either.
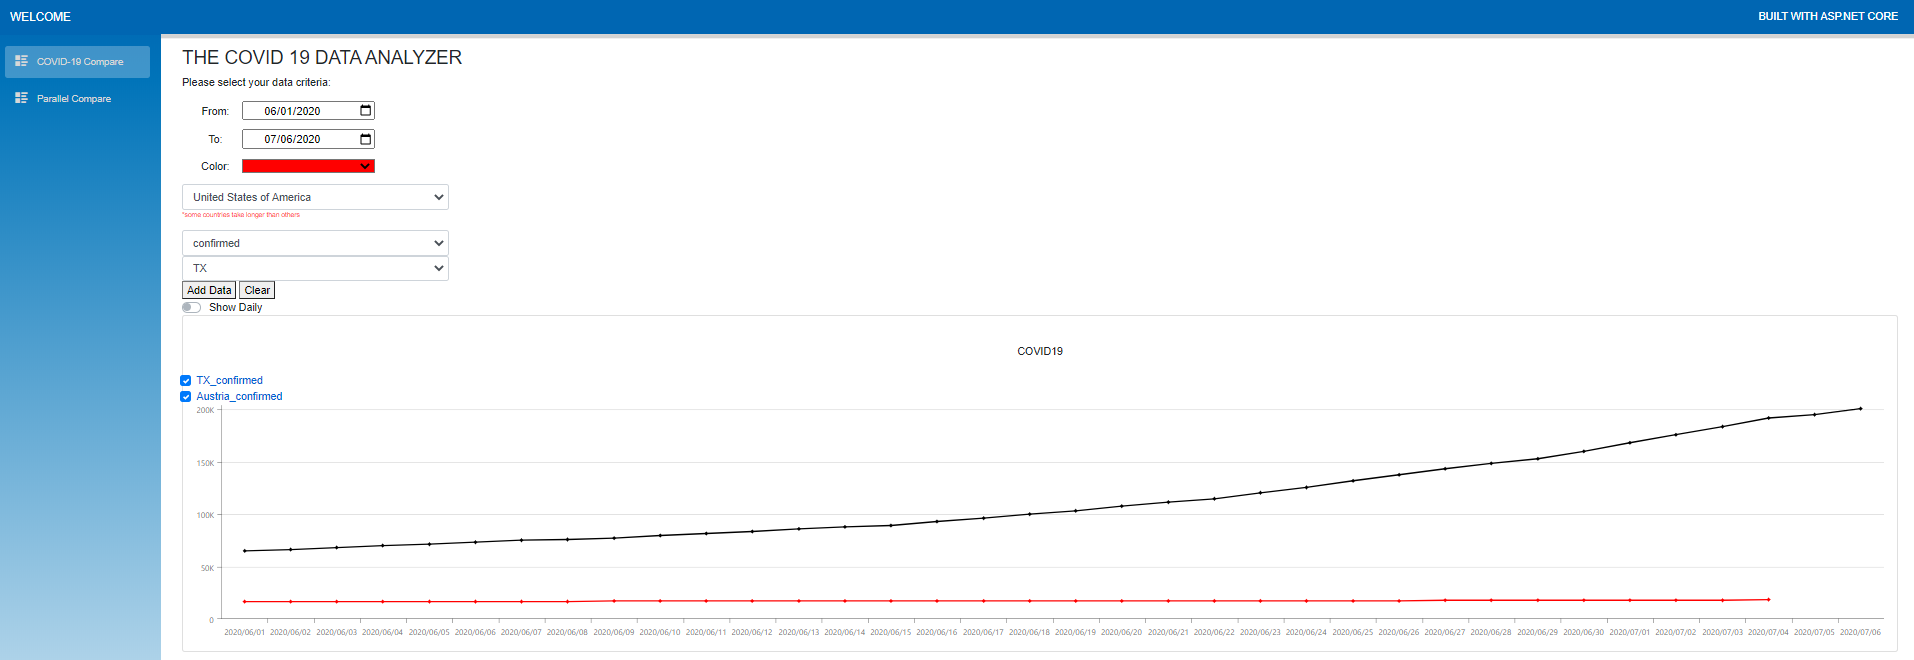
If you browse to the published server-side application, you'll notice that it also includes a page with a different component, which shows a graph that allows you to compare individual countries as a separate series within one chart. In this visualization, you can even compare countries to US states (here is where that Province parameter previously mentioned comes in handy). I included a date picker to select From and To dates, a color picker for chart line colors, and the ability to display the daily case changes as opposed to the accumulated total number of cases. I also changed the application color scheme a little bit (Figure 7).
Post-Race Conference and Analysis
Both the client-side and server-side Blazor version of this application remain under development and will receive continuous updates on a regular basis as more features and components are added. This project has led me to the conclusion that the client-side Blazor technology is certainly ready for real production projects. That, of course, doesn't mean that it should or needs to be used for every single upcoming Web project. And for some projects, server-side Blazor might even be better suited. Ultimately though, I can confirm the following:
Full stack .NET Web development has shifted into second gear and moved over into the passing lane. JavaScript-powered frameworks might still lead in this race, but Blazor is definitely equipped with a Turbocharger and, at some point, might challenge JavaScript for the Pole Position in this Grand Prix of Web Development.