


In my previous article in CODE Magazine, I shared some tips and tricks I use with Chrome DevTools. To refresh your memory, Chrome DevTools is that window that launches when you hit F12 on Windows or CMD_OPT_I on a Mac. If you've developed for the web, be it HTML, CSS, or JS, I'm sure you've used them at some point.
My focus wasn't to talk about the basics of Chrome DevTools, but more about the hidden, and very interesting, tips and tricks I use to super charge my dev lifecycle. As I started writing the previous article, it became clear that there's so much more! So here I am with even more Chrome debugging tips.
Find Unused JavaScript
As is common when you write code for any project, the codebase gets larger and larger. Over time, the individuals who checked in certain code, with inexplicable comments, leave the company, retire, get hit by a bus, or win a lottery. And now you're paralyzed. You don't know if removing certain code will cause a missile to launch elsewhere in the world. JavaScript is no different. You will frequently have gobs and gobs of code, and no idea how useful it is. This can become a real problem in sites where performance matters.
Chrome DevTools have a convenient mechanism to allow you to find what percentage of any JavaScript file has been used, as per the actions performed on the page so far. Additionally, it can show you block by block or function by function what portions of code have been executed, and what portions are just sitting there taking up space.
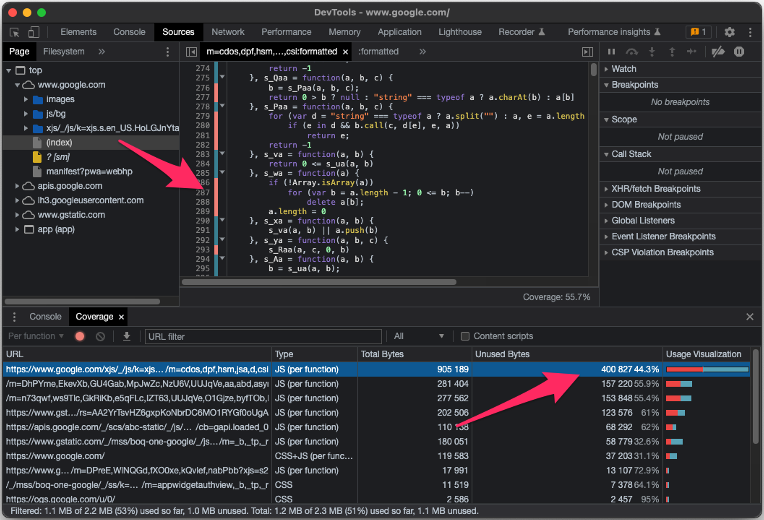
This is invaluable in finding JavaScript on a page that's never been called. Here's how you can find unused JavaScript on any page. Open any popular site; in my case, I went to Google's home page. Open DevTools and go to the sources tab.
Now launch the coverage tab using CTRL_SHIFT_P (Windows) or CMD_SHIFT_P (Mac), and choose to reload the page. As you can see in Figure 1, the red portions clearly show you which portions of your JavaScript have so far not been executed. Additionally, it shows you a bar chart saying which files are the least used, along with total bytes and unused bytes. This is a great way to focus on the top optimizations you can perform on the page. You can continue to interact with the page and see how this data changes, and use it to make informed decisions around optimizing your page.
Finding and Working with Elements
One of the things Chrome DevTools is really good at is working with elements. There are so many tips and tricks hidden here! At the very simplest, if you glance at the top left of Figure 1, you can see an arrow icon on a rectangle. Go ahead and click on it and point to any UX element on the page. You'll see that chrome immediately selects, in code, the element you have visually pointed to.
But it doesn't end there. Hit ESC to reveal the console drawer, or just tab to the console tab, and type $0. This gives you a shorthand variable for debugging purposes that represents the current element. Now point to another element and type $0 - it shows you the newly selected element. You'll find that $1 shows you the previous element you pointed to.
Now with an element selected, do a right click, and go to copy > copy selector, as shown in Figure 2.
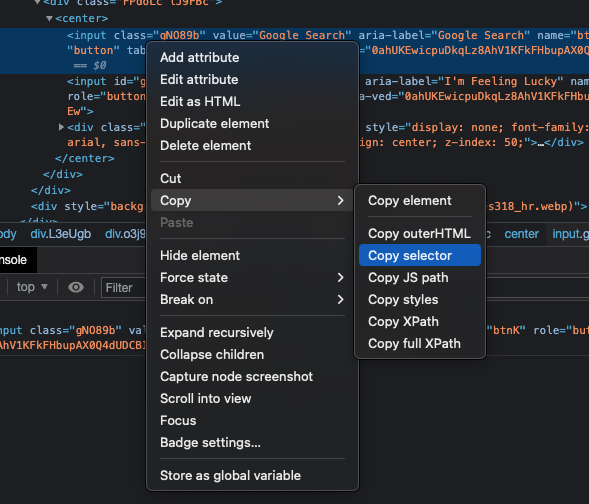
This copies the jQuery selector as text into your clipboard. Chrome DevTools support the jQuery selector syntax for debugging purposes. You can try this by typing $("") in the console window and typing in the selector you just copied. It should immediately select the element you'd pointed to. I find this tip very helpful in figuring out complex jQuery selector syntaxes.
In the menu shown in Figure 2, there are a bunch of other useful tricks. My favorite one is “Break on,” which allows you to force a breakpoint in JavaScript if the DOM of a particular element changes. This is great when you know some piece of code is changing some UX, but you just can't figure out what. You can hit the breakpoint and easily glance at the stack trace to see what portion of your code caused the UX change to occur.
XHR Breakpoints
JavaScript code can get complex. When you write AJAX code, one of the challenges is dealing with multi-threaded code. As you know, JavaScript doesn't really support multi-threading like C++ or C# do. To be precise, you can have threads, but you can't have strict control over how threads step over each other. This means that it can be difficult to pinpoint exactly what sequence of events caused an XHR request to fire.
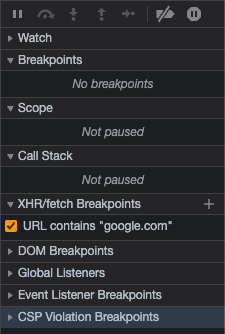
To solve exactly this problem, you have XHR breakpoints. In the sources tab on the right-hand side, there's a section for XHR breakpoints. As you can see from Figure 3, I've set a breakpoint such that anytime an XHR request is sent to *.google.com, a breakpoint is automatically hit.
Now, I just have to sit back and wait. To my surprise, without my intervention in downtimes, www.google.com on a Mac was making XHR requests to play.google.com. Puzzling! But now I have the ability to debug why.
Conditional Breakpoints
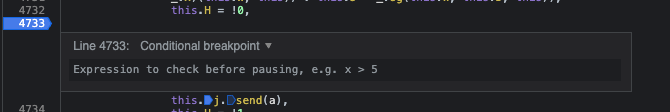
When debugging JavaScript, you use breakpoints. But there's a good chance that you have a loop that gets called over and over again. Wouldn't it be nice if you could hit the breakpoint only if a certain code condition matched? This is the job of a conditional breakpoint. Simply set a breakpoint and right-click on it and choose to Edit breakpoint. You'll be presented with a user interface, as shown in Figure 4, where you can now input an expression. Whenever that expression evaluates to true, that's when the breakpoint is hit. Otherwise, the breakpoint is simply ignored.
Easily Convert Images to Data URIs
Data URIs are a recent enhancement to web standards. They're a great way to include data inline on web pages. A good example is an image. You can reference an image using the img tag. But this causes a separate HTTP request. Each request has its own lifecycle and generally slows things down. When working in development mode, you have numerous files with various extensions. Some are for fonts, some are JS, some are CSS, and some are images. These are usually kept separate. What helps you during development, works against you in production.
Luckily Chrome DevTools let you easily convert any image into a data URI format. This means that for commonly used images on a page, you can avoid an extra HTTP call. Not only does this help your page load faster, it also means items are available as soon as the page is available because they're all downloaded together.
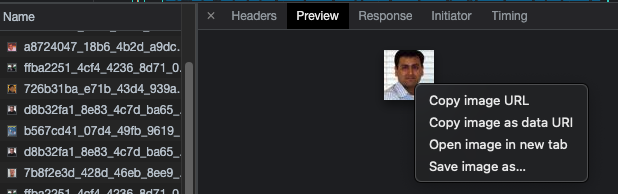
Converting an image to data URI is quite simple. Go to the network tab and look for the image you're interested in. Click on the image, and go to the Preview tab. On the image itself, do a right-click and choose “Copy image as data URI,” as shown in Figure 5. That's it, now replace your img src with this data URI, and the image is served inline with your HTML text.
Simulate Network Conditions
Developing for the internet is hard. Developers usually have high-end computers, but their customers may not. You could easily write a website that someone on a low bandwidth connection on an old device may have a hard time using. How do you simulate such situations? Chrome DevTools to the rescue.
In the network tab, hit ESC to open the console window, and on the left-hand side, look for the triple ellipsis button. Click on it to open Network conditions. Here you can do some interesting things, such as disabling caching, throttling network speeds, or changing user agents. This can be seen in Figure 6.
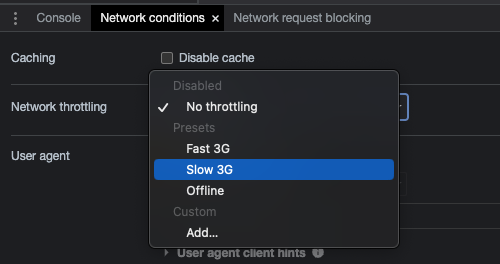
Additionally, you can selectively block certain requests by adding patterns under the Network request blocking tab. This is useful to simulate overzealous network admins that you're trying to work around, just in case they block access to CDNs etc.
In-Browser Code Editing
How do you develop? I typically have my IDE such as VSCode open, and maybe I use live-reload if the project supports it. But mostly, it's a matter of editing code, pressing save, compiling if necessary, and hitting F5 to see if my code worked. This is terribly inefficient, especially when I'm trying to debug a hard to corner issue.
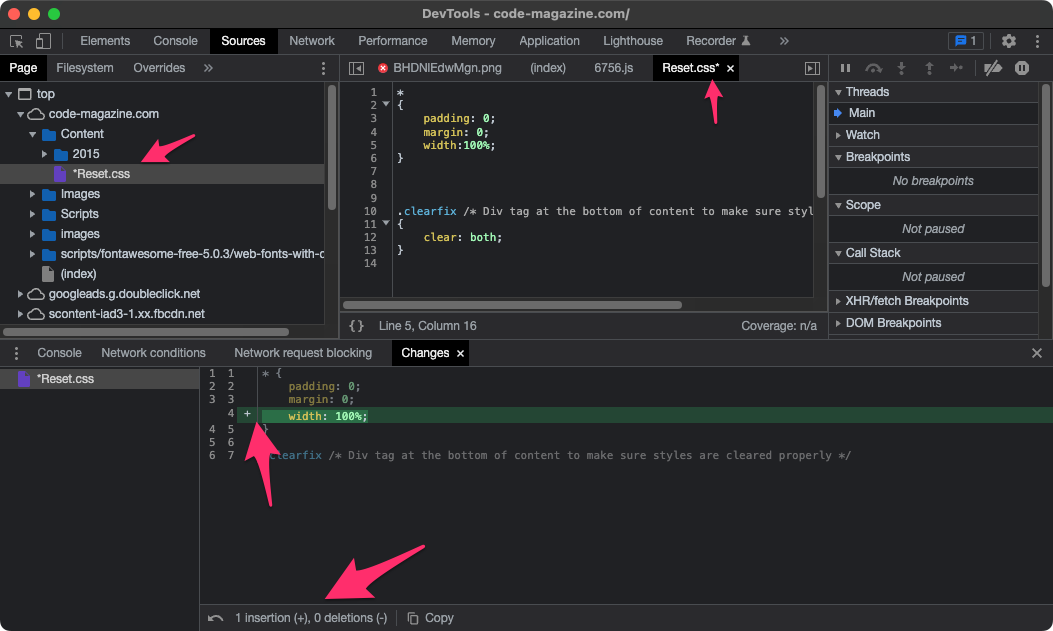
Chrome lets you do inline code editing right in the browser. For instance, I visited www.codemag.com and in the Sources tab, I noticed there was a file at /Content/2015 called Reset.css. I could simply open it and start editing it, and see the results apply live in the browser. This works with any kind of file. But it gets better.
The challenge is that once I've fixed a problem, I still need to collect the changes from the browser session and make them permanent by copying them to my source code in VSCode.
Go to the Sources tab in Chrome DevTools and hit ESC to open the console drawer. Here, click on the ellipsis button and look for the Changes menu. You can visually examine all the changes you had to make to get something working. Not only do Chrome DevTools show you which files are changed, it also shows you exactly what changes were done.
And when you are done making changes, simply hit the Copy icon at the bottom in the status bar to copy the changes to the clipboard. Now you can paste them into your original source code and make the code changes permanent. This can be seen in Figure 7.
The CSS Overview Panel
The CSS overview panel is a great way for you to analyze the CSS on any given page, and even identify potential improvements. Open the Chrome browser and visit www.codemag.com. Open DevTools and press CMD_SHIFT_P (Mac) or CTRL_SHIFT_P (Windows) and launch the CSS overview panel.
You'll be greeted with a new panel that gives you a button to capture an overview. Go ahead and click on it. Clicking that button analyzes the CSS in use on the page. The created report has five sections.
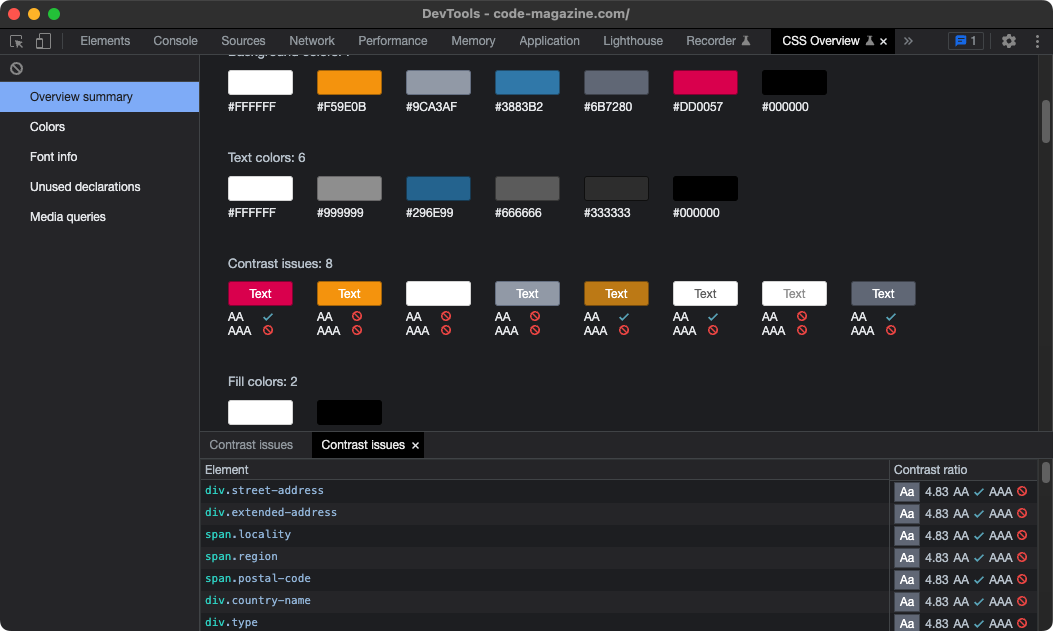
The overview section gives you a high-level summary of your page, the elements, the external stylesheets, etc. Here, you can easily capture whether you have any inline styles in use for instance. It also shows you possible contrast issues that may make it harder to read text. This can be seen in Figure 8. Clicking on any specific contrast issue also shows you exactly where that contrast issue is present and double-clicking on that element takes you to the element in the source code of your HTML so you can examine it and experiment with fixing it right within DevTools.
The colors section, as the name indicates, gives you an overview of the colors in use on your page. Here also, each color is clickable so you can easily examine where a color is in use.
The Font Info section, as the name indicates, tells you which fonts are in use and where they're coming from. Additionally, it'll show you the number of occurrences of each font.
The unused declarations section shows you redundant elements that are present but may not have any effect on your page. For instance, on CODE Magazine's home page, it tells me that the vertical alignment style is applied in four places where the element is neither inline nor a table-cell. Removing that has no effect on the page, so you might as well clean up your code and remove it. Again, you can click on the section and navigate in code to where those elements are, and then easily locate the problems and clean up your code.
Finally, the media queries section shows you all of the media queries defined on your page sorted by the number of occurrences. As you may be aware, media queries allow you to specify different behaviors for different resolutions. If you've used media queries before, you know how easily they can get messy and it's a whole lot easier to keep them at a top level and clean to keep them manageable. This section will help you achieve that.
Easily Identify Memory Leaks
You'll find this tip extremely useful when writing complex pages. To try this out, visit a heavy website: I visited maps.google.com. Open DevTools and open the Performance tab. Here, choose to profile for memory in the checkboxes at the top and start recording. Now interact with the page as you normally would. And stop recording. You should see a capture, as shown in Figure 9.
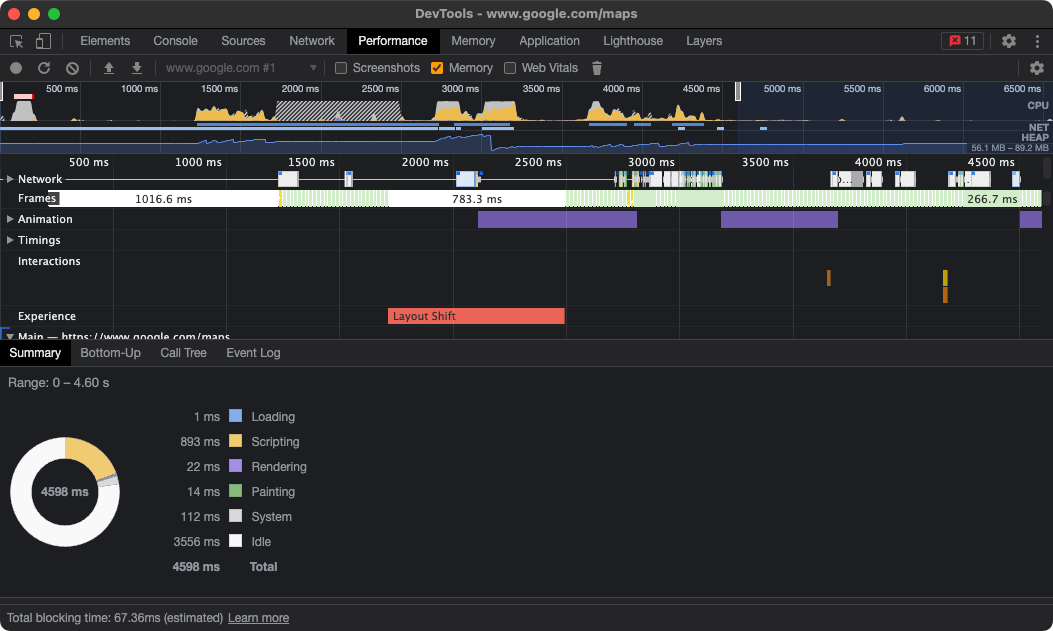
There's a wealth of information captured here. You can easily identify where the bottlenecks are, whether they're in network, or whether they're animations. The blue graph you see is memory usage; if you see that rising constantly, you know that you have a problem. Underneath, you see exactly where time was spent. You can see an overall summary, but by navigating through various tabs, you can also see exactly which function call took how much time, and at what point it occurred.
To do an even deeper analysis, open the Memory tab of DevTools, and choose the Allocation instrumentation on timeline option and start recording. As usual, interact with the page normally, and stop recording after a while. This produces an output similar to that shown in Figure 10.
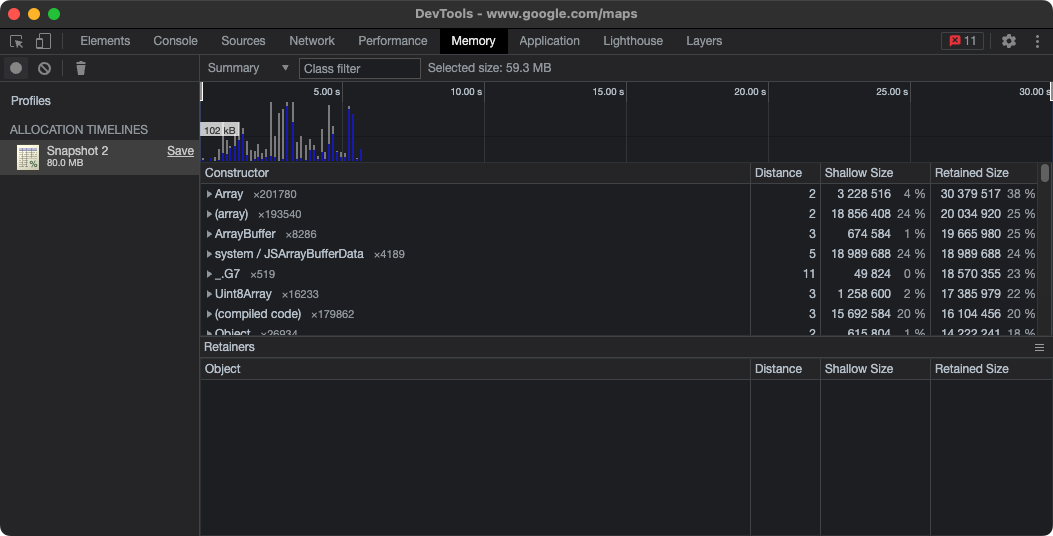
Here, you can see that memory that's allocated and not deallocated is shown in blue. Memory that was freed up is shown in gray. You can look at exactly where and how the memory is being used, sorted by usage. You can select a small portion in the timeline of the memory footprint and select a specific element. This shows you the full object tree and shows you exactly what object had consumed how much memory at what time. This can help you identify the largest memory piggies on your page.
Simulate Mobile Devices
Let's be honest, these days, if you're targeting only desktops, you're missing the party. Chrome DevTools includes capabilities to help you develop for mobile while being on a desktop. These tools can be seen in Figure 11.
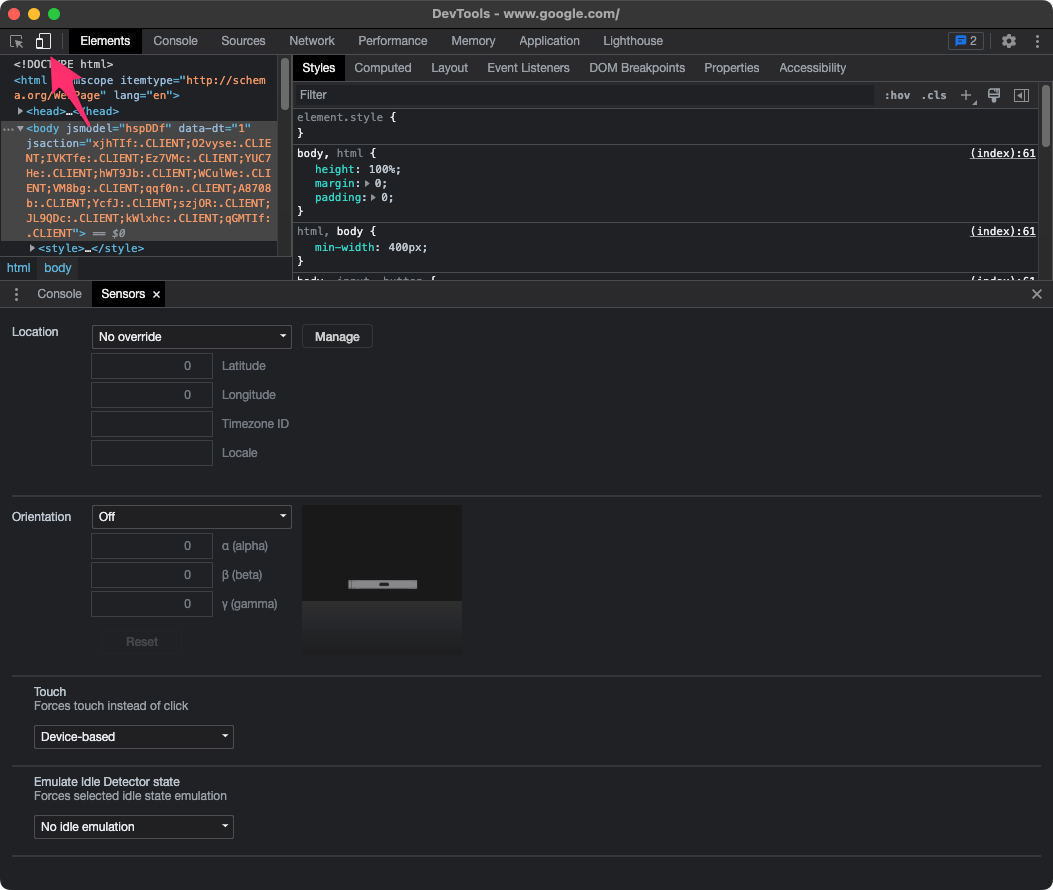
At the most basic, you can click the button indicated by the red arrow in Figure 11. Clicking that button lets you simulate almost any mobile device as far as dimensions and DPI go. There are many presets to choose from or you can define custom presets. Additionally, you can choose to pick throttling behavior to simulate loading on different wireless networks.
However, developing for mobile isn't just resolution and DPI. Mobile devices frequently make use of capabilities such as location, orientation, or touch. All of these are grouped under Sensors, which can be opened next to the console tab, as can be seen in Figure 11.
Mobile devices also frequently make use of local storage, Web SQL, or IndexedDB. All of these can be explored under the application tab.
Finally, if you can't simulate something on a laptop and it must be diagnosed on an actual mobile device, you can physically connect an Android phone to your Mac or PC, and use Chrome DevTools to debug a webview running on the physical mobile phone. This, naturally, only works for Android. However, if you must diagnose iOS, there are similar capabilities in Safari.
Master the Console
Okay some days, all these fancy debugging tools take a back seat to the old fashioned console.log. You might already know that the console.log lets you log out some text in the console window. For instance, this is a valid console.log entry:
console.log("debug message");
But console.log is quite powerful. You can use expressions, such as %s, like this:
console.log("data %s", "something")
This prints out:
data something
This is great for writing out expressions built using variables. You can even style the output. This can be seen in Figure 12.
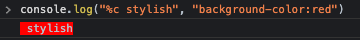
This is a great mechanism to make certain that messages stick out prominently. Of course, you can also use console.log, console.info, console.error, console.warn, or console.assert to treat messages differently.
Another corollary of console.log is console.table. Sometimes you wish to write out an array, but you wish to view the output as a sortable table. For instance, you want to easily find all the external scripts referenced on a page or all the hrefs on a page. To do so, you can simply issue a console command as follows:
console.table(document.scripts, "src")
This command writes out all the scripts on a page as a table output and shows the index and src columns.
Yet another trick you can use is console.count. Sometimes you wish to count the number of times a certain function or line was executed. You can simply issue the following statement:
console.count("label")
As many times as this line is executed, you'll see an incremented count written out. You can change the label text to count more than one occurrence on a page.
Finally, there's console.group. Sometimes you get so many console.log messages that it becomes very difficult to parse through them. You can render console messages in collapse/expand groups using console.group, console.groupCollapsed, and console.groupEnd. This is best seen in Figure 13.
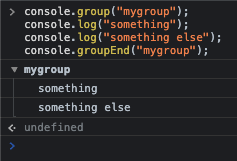
The idea here is that you can initiate a group of messages by passing in a label. The label is what allows you to eventually close that group by passing the same label name to console.groupEnd. Now any messages between these two group calls get grouped in a collapse expand section, as can be seen in Figure 13. Of course, if you wish to initiate a group in a collapsed state, you can start the group by calling console.groupCollapsed.
This is great when you wish to log a certain method's output, but you want to collapse to out of your view so you can focus on the larger picture.
$
Okay, we all like $, but I'm talking about a better version. There's the $ symbol in the JavaScript world that we're all familiar with. This is what jQuery chooses to use as its shortcut. In Chrome, the $ symbol with its jQuery like effects is built right into Chrome DevTools. Well, it's not all of jQuery, but the general selector syntax works. To be specific, it's a shortcut for document.querySelector, and $$ is a shortcut for document.querySelectorAll.
Now to be clear, this is just a debugging tool and you shouldn't bake dependencies into your production code based on this $ symbol that may not be available in other browsers. But it really helps working in the debug console window. Let's try it out.
Go to the CODE Magazine home page (www.codemag.com) and open DevTools. Now issue a command as follows:
$("div")
This shows you all the divs on the page as an array. You can expand this array and click on any element to quickly navigate to a particular element. Or you can use console.table to work with this array. If you're a seasoned JavaScript developer, you can use more complex syntax. For instance, I know that there's a div on my page that has an ID of mobileMenu, and inside there, there is a ul, and I want to find whichever element has the “magazineMenu” class. No problem. Here's how you zero in on that.
$("#mobileMenu > ul > li.magazineMenu")
There are some additional interesting shortcuts built in here as well. For instance, typing $_ or $0 gives you a reference to the current element. $1 gives you the last, $2 gives you the one previous to that, and $3 and $4 goes to the ones before. You can imagine how useful this can be as you're going through elements in debugging and need to step back to the last element you were looking at.
You'll find that $_ is slightly different from $0. That's because $_ is technically the last evaluated expression. So $_ is a bit broader in its applicability than just user interface elements.
For instance, frequently I find myself doing math. And more and more, I'm getting dumber at doing math in my head. I know, not a great habit. I use a Mac, so I find myself doing quick calculations using Spotlight. Like 848+481=1329. Or maybe I'll ask Siri or OK Google to do some quick math for me.
Frequently, I need to something just slightly more complex. I dive into Google Sheets or Excel. But there's a middle ground, where I need to do some quick math, be able to use variables, and do it visually.
Let's say that I have $848 in one bank account and $481 in another bank account, today is February 14, and I wish to know how much can I spend per day till the next paycheck on March 1. You can see me doing this quick math in Figure 14.
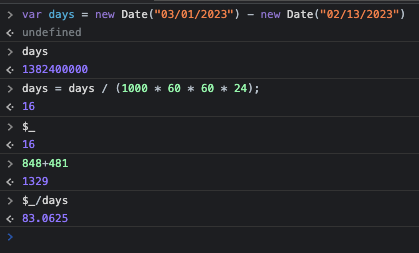
It's worth pointing out that JavaScript's math is buggy, so I use it for informal calculations. There are npm packages available to do complex and more accurate math if need be, but for my quick and dirty calculations, this works great!
You can extrapolate other uses of $_, such as you can evaluate a code snippet that you drag and drop from your disk, save it in a temp variable as a function, and reuse it in any way you like.
JSON
JSON stands for JavaScript object notation. It's a data transfer format with some basic data type semantics. It lets you store unstructured/semi-structured data. What's great about it is that it doesn't consume a lot of space, like XML, and all modern browsers have a native JSON parser built into them. That object is called JSON.
A good example of serializing an object into JSON can be seen in Figure 15.
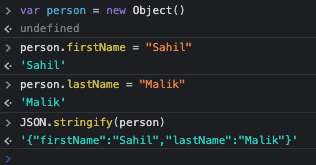
Just like you can JSON.stringify an object into a string JSON representation, you can do the reverse using JSON.parse.
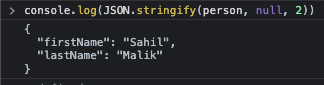
There's one issue here. My JSON object here is very simple. It's not uncommon to see JSON objects that are huge, a few megabytes even, and that span multiple pages and have deep nested structures. Reading them can be quite onerous if they aren't formatted well. There are tools online that let you parse them nicely, and JSON objects fetched over XHR can be viewed nicely formatted inside Chrome DevTools' network tab. However, if you wish to arbitrarily format a JSON object in a more readable format in console, you can use the expression seen in Figure 16.
A Quick Scratchpad
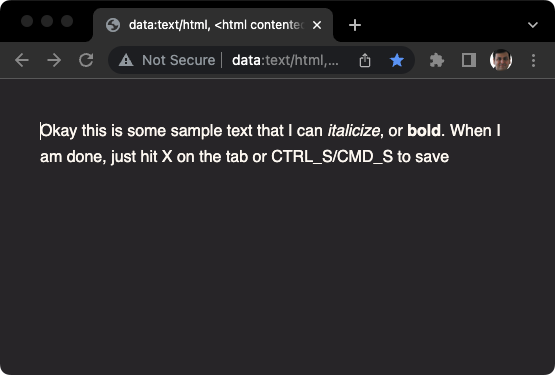
Chrome is incredibly flexible. More and more, all my tools are being coalesced into a browser. I can almost guarantee that I always have the browser running on my computer. When I need to take a quick note, this tip comes in super handy. Almost like an ephemeral sticky note. I create a bookmark in the bookmark bar and use a convenient emoji for the title, so it doesn't take up too much space, and the following as the URL. Note that line breaks are for clarity.
data:text/html,
<html contenteditable spellcheck style="font-family:helvetica;
    line-height:1.6;
    background-color:2c292d;color:fdf9f3;
    padding:32"/>
Now, whenever I wish to take a quick note, I just open a new tab and hit the bookmark button in the bookmark bar. Or you can even make this your start page. Once this tab is open, just start typing in this new browser tab. This can be seen in Figure 17. Whenever you're done, just hit CMD_S/CTRL_S to save this text, or just close the tab to get rid of it.
Summary
Web pages seem to be stuck together with sticks and spit. It's amazing how we've managed to build some incredibly complex applications using fiddly web technologies that have grown organically with time, such as HTML, CSS, and JavaScript. Frankly, it's amazing that, given all the diverse operating systems, browsers, versions, these fiddly technologies power the compelling applications that are the bread and butter of a major portion of the world's GDP. Think about it, Facebook, Twitter, Amazon.com, Google, Office 365, Google docs - so much else - are complex web applications. I'm not diminishing the role of back-ends here, but hats off to the engineers that've built the front-ends for all these technological revolutions.
At the heart of all this are good tools, such as Chrome DevTools, that help developers identify some of the hardest to nail down issues in some of the hardest to debug environments.
I hope you found a tip or two useful in this article, something you didn't know before.
Until next time, happy debugging.