


In software development, understanding user engagement is invaluable because it gives you the foresight needed to tweak your users' experience and maximize the usability of your software. When building software, the first iteration is usually an educated best-guess as to what experience will resonate with your target audience. Once users begin to get their hands on the product, the data of how they interact with what you've built can deeply influence the next iteration. Without that data, you end up basing a large portion of your deliverable on a dice roll, guessing at the best experience but never really knowing the source of pain points or successes, at least not across your entire user base.
In many instances, budget drives priorities and, often, the emphasis gets put on execution of the product and less on fancy analytics and metrics tracking. Luckily for us, tools exist that offer robust data insights with next-to-no added development cost. Mixpanel is a great example of such a service.
Mixpanel allows developers to drop hooks onto any screen using a single line of code per event they want to track, much like the implementation of Google Analytics, for example. Once this is done, you can begin to set up funnels to track engagement across the application using Mixpanel's intuitive dashboard without any additional programming. Let's take a closer look at what it takes to integrate the service and how you can use the service to better understand usage habits and pain points in your software.
Mixpanel
Mixpanel serves over 20,000 customers in more than 150 countries world-wide. Those customers collectively track over five trillion data points each year. Mixpanel was designed to perform at scale, boasting an average of 50,000 events scanned per query with growth potential as high as 10 billion events scanned in a single query, all with less than one second median query speed.
Mixpanel was designed to perform at scale, boasting an average of 50,000 events scanned per query with growth potential as high as 10 billion events scanned in a single query.
Introduction
Mixpanel's main objective is to help you understand your users' journey as they interact with your software. Whether you're working with iOS, Android, Unity, JavaScript, PHP, Ruby, or a number of other supported technologies, Mixpanel allows you to follow the digital footprint of your users across Web and mobile devices. They do this with a variety of tools that come bundled with the service offering.
The Mixpanel tools cover everything from engagement and automated insights, to funnels and A/B testing. Using the full suite, you can answer questions like:
- Who are my power users and what features do they love most?
- How can I keep customers engaged in my application for longer periods of time?
- How can I improve my acquisition flow to convert more users?
- How did the ROI on my latest social media effort stack up to my previous campaigns?
Event Tracking
Most of the reports and insights that Mixpanel offers result from aggregating and interpreting user-tracked events. In the Mixpanel world, certain events are tracked automatically just by enabling the SDK on your respective client. Those auto-tracked events depend on the platform you're working with. For instance, the mobile SDKs tracks the following by default:
- First App Open: As you might expect from the name, this event tracks the first app open from the user and doesn't record apps open beyond the first.
- App Updated: Tracks when a user who was already on your platform updates to a newer build.
- App Crashed: Fires whenever an exception or signal indicating that the app has crashed is received. (This isn't supported in the Swift SDK for the time being.)
- In-App Purchase: Logs when an IAP has been executed and also passes along the Product Name, Product Quantity, and Product Price as parameters on the event so you can better understand purchase habits. (This isn't supported on Android currently.)
In most cases, you'd like to explore usage patterns on a more granular and custom level. To do this, you use Mixpanel's SDK to send custom events. You can trigger these events anywhere in your software so they can cover anything from a simple screen view to a complex sequence of actions. Custom events have two important pieces of information attached to them: the event name and the event properties. The name is a requirement, as it helps identify the event in Mixpanel's dashboard. Properties, however, are optional. To demonstrate how this works, the following snippet is an example of an event tracking call made in Swift.
Mixpanel.mainInstance().track(event: "Plan Selected",
                              properties: ["Plan" : "Premium"])
In this example, you can see that the event trigger is attached to the user selecting a certain plan, and the properties attached to the event describe the plan chosen. Using properties, you can get more granular in the funnels and reports that you generate off of the data. For instance, a single event could be funneled to show metrics like:
- Out of all users that select a plan, what percentage chose premium?
- Out of all users who accessed the application, what percentage chose any plan?
- What is the percentage of conversion of all users to a premium plan?
What if you wanted to get even more granular then that? For instance, let's say you wanted to see what percentage of your premium plan users are more than 30 years old. You can do this using Super Properties.
The age of the user isn't something you want to pass with each event tracking call you make. Instead, you can register Super Properties at the user level. Registering a super property looks like this:
// "Age: 25" property will be sent with all future track calls.
Mixpanel.mainInstance().registerSuperProperties(["Age": 25])
Now, if you called the track event for “Plan Selected” shown in a previous snippet, the age property is automatically appended to it. In essence, it's the same as if you made the following call manually:
Mixpanel.mainInstance().track(event: "Plan Selected",
                         properties: ["Plan" : "Premium", "Age": 25])
You don't have to limit events to a fixed moment in time either. For instance, let's say your application lets the user upload media files and you have concern that the upload times are too slow. With Mixpanel's timing events, you can track the upload times to better understand the impact across the entire user base. Simply call the event timer when the event starts and call it again when the event is completed. The process looks like this:
Mixpanel.mainInstance().time(event: "Image Upload")
//...some time later
Mixpanel.mainInstance().track(event: "Image Upload")
Beyond Event Tracking
Although general event tracking is responsible for the majority of insights you derive from Mixpanel, it's not the only tracking feature available. Mixpanel can also associate and aggregate user information using its People Analytics feature. To do this, you create a profile for the user, which creates a persistent set of properties relative to the respective user; this includes properties such as name, email, signup date, and so on. This approach segments your users by who they are, opposed to what they did. Let's take a quick look at how it works.
Mixpanel can also associate and aggregate user information using its People Analytics feature, creating a persistent set of properties relative to the respective user..
By default, a random distinct ID is assigned to each unique user in your application. This is how Mixpanel identifies where the tracked events come from. If you decide to register profile properties using the People service, it associates those properties to the same distinct ID that it's already using to track event actions for that user. This ID is auto-generated. To override it with something custom that makes more sense within the confines of your own data/system, simply make a call as follows:
// Ensure all future events sent from
// the library will have the distinct_id 13793
Mixpanel.mainInstance().identify(distinctId: "13793")
To save properties relative to the ID 13793, use the People object within Mixpanel's SDK. Sticking with the plan example, setting the user's selected plan as a property in their Mixpanel profile looks like this:
// Sets 13793's "Plan" attribute to "Premium"
Mixpanel.mainInstance().people.set(property: "Plan", to: "Premium")
Profile properties don't have to be fixed string values either; they can also be incremental numeric values. For instance, let's say you have an application that uses a point value as a type of in-app currency and you want to gather insights on the average point counts across your user base. In that scenario, you could set the initial property value and then simply increment the value by positive or negative amounts as your user earns or spends their points. That increment call looks something like this:
// increment the user's point count by 500
Mixpanel.mainInstance().people.increment(property: "point count", by: 500)
Additionally, Mixpanel also has a special handler for tracking real money transactions. Those tracked events bubble up into Mixpanel's revenue reports. Tracking charges for a user looks like this:
// Tracks $100.77 in revenue for user 13793
Mixpanel.mainInstance().people.trackCharge(amount: 100.77)
// Refund this user 50 dollars
Mixpanel.mainInstance().people.trackCharge(amount: -50)
The possibilities don't stop there either. If you'd like to read more about Mixpanel's additional offerings, including push notifications, A/B Testing, flow and value tweaks, and multiple instancing, check the sidebar for links to the respective documentation.
Processing Your Data Using Funnels
Now that you've got an idea about how to collect data, let's take a look at what you can do with the data you've collected. Referring back to the sample from earlier involving a premium paid plan, let's say you have a free software solution that also sells subscription-based upgrades and there are two plans to choose from: standard and premium. You'd like to see the conversion rate of all the individuals who view the upgrade plan's screen so you can know how many of them choose a plan. In addition, of the individuals who choose a plan, how many choose the premium plan. Finally, out of the users who choose premium, you're interested in what percentage converted and completed the monetary transaction.
On the client side, you then track the following three events:
- View Subscription Upgrades: This event triggers when a user accesses the plan upgrade info screen.
- Plan Selected: This event is triggered when either the standard or the premium plan is chosen. Attached to this event is a property called Plan that either contains Standard or Premium.
- Plan Purchased: This event is triggered when the user completes the transaction. The
Planproperty on this event indicates the purchased plan.
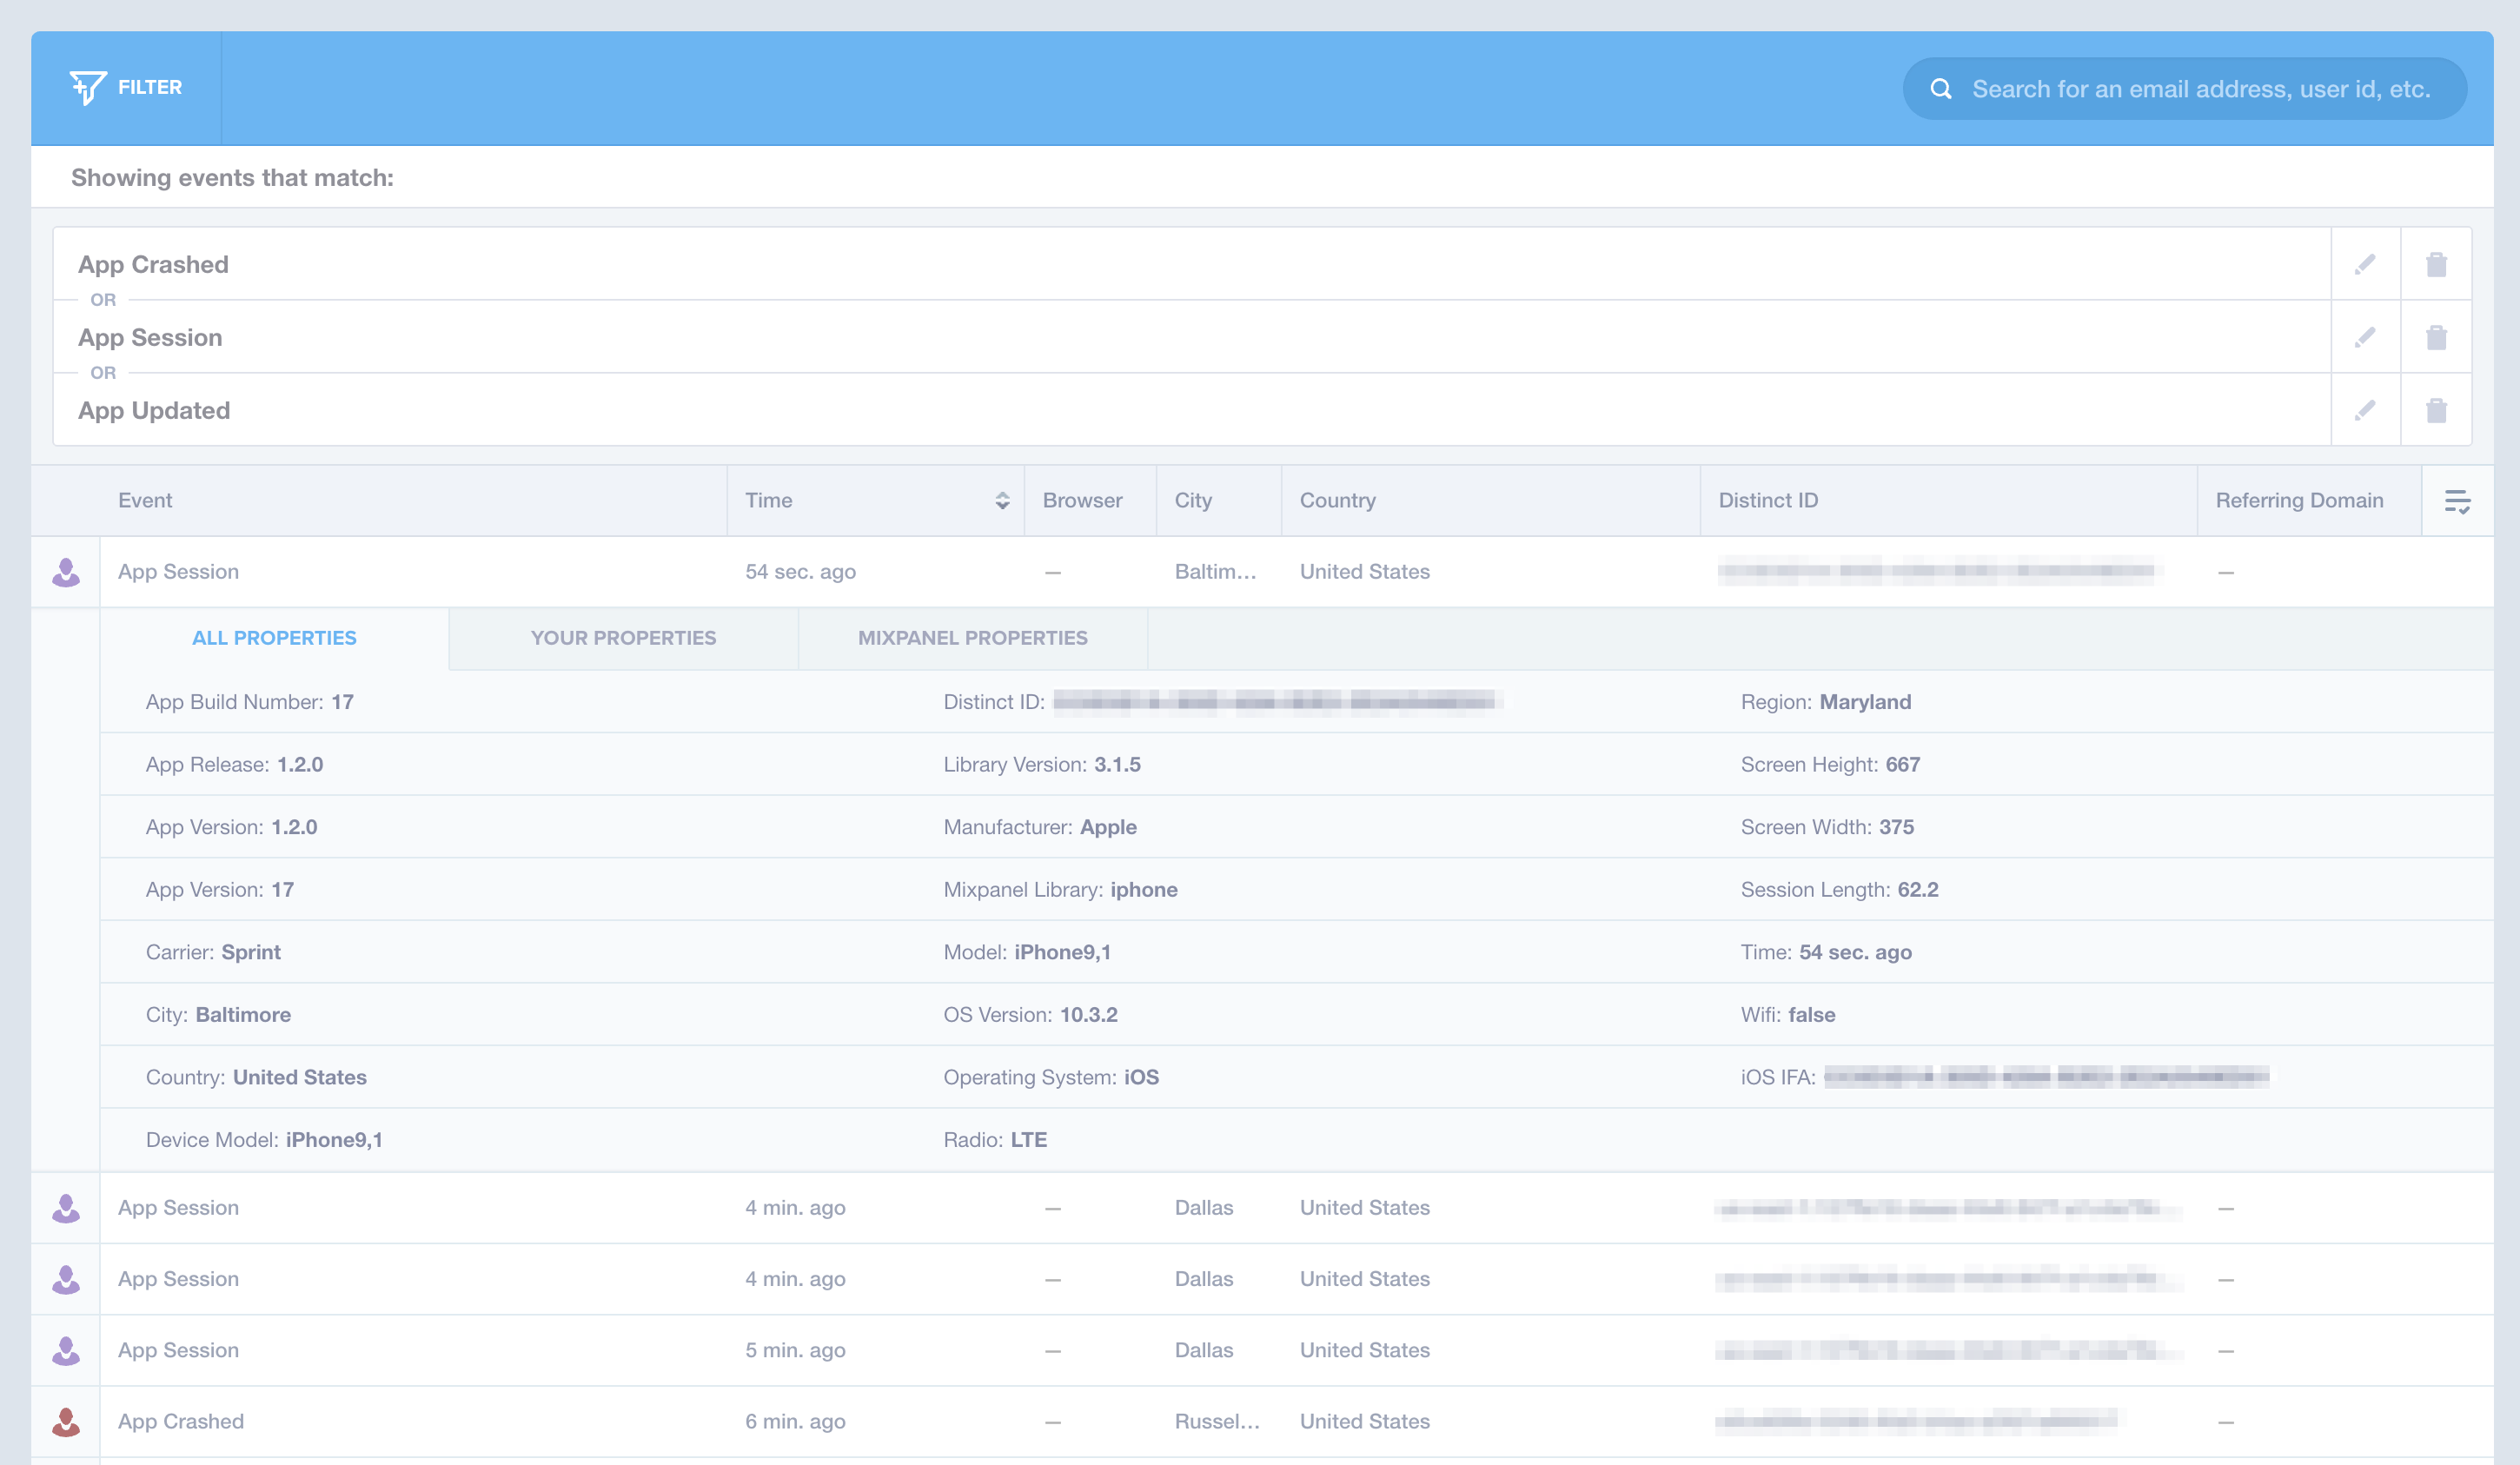
Assuming this scenario, you'd first login to your Mixpanel account. Once logged in, you see a menu on the left-hand side with an option that says Live View. If you click into this section, it shows you a rolling list of app events as they trigger. This is a good starting point to verify that the desired events are tracking appropriately. You can also filter this view by specific events and/or properties to get a more granular look at recent happenings. Figure 1 demonstrates what the live view looks like with multiple filters applied. Also notice in Figure 1 that the first event is expanded. This expanded view shows you the properties that Mixpanel records on the event automatically. Additionally, if you log any custom properties on your events, those will show there as well.
Once you've verified that your events are tracking as expected, you're ready to build your first funnel. Creating a funnel is easy: you're merely defining a series or sequence of events to follow. In this case, the series is view plan | selected plan | purchased plan. To build a funnel that shows the insights from this described example, use the left-hand menu and click on the option labeled Funnels. Once there, find the New Funnel button and click that to take you through the funnel creation process.
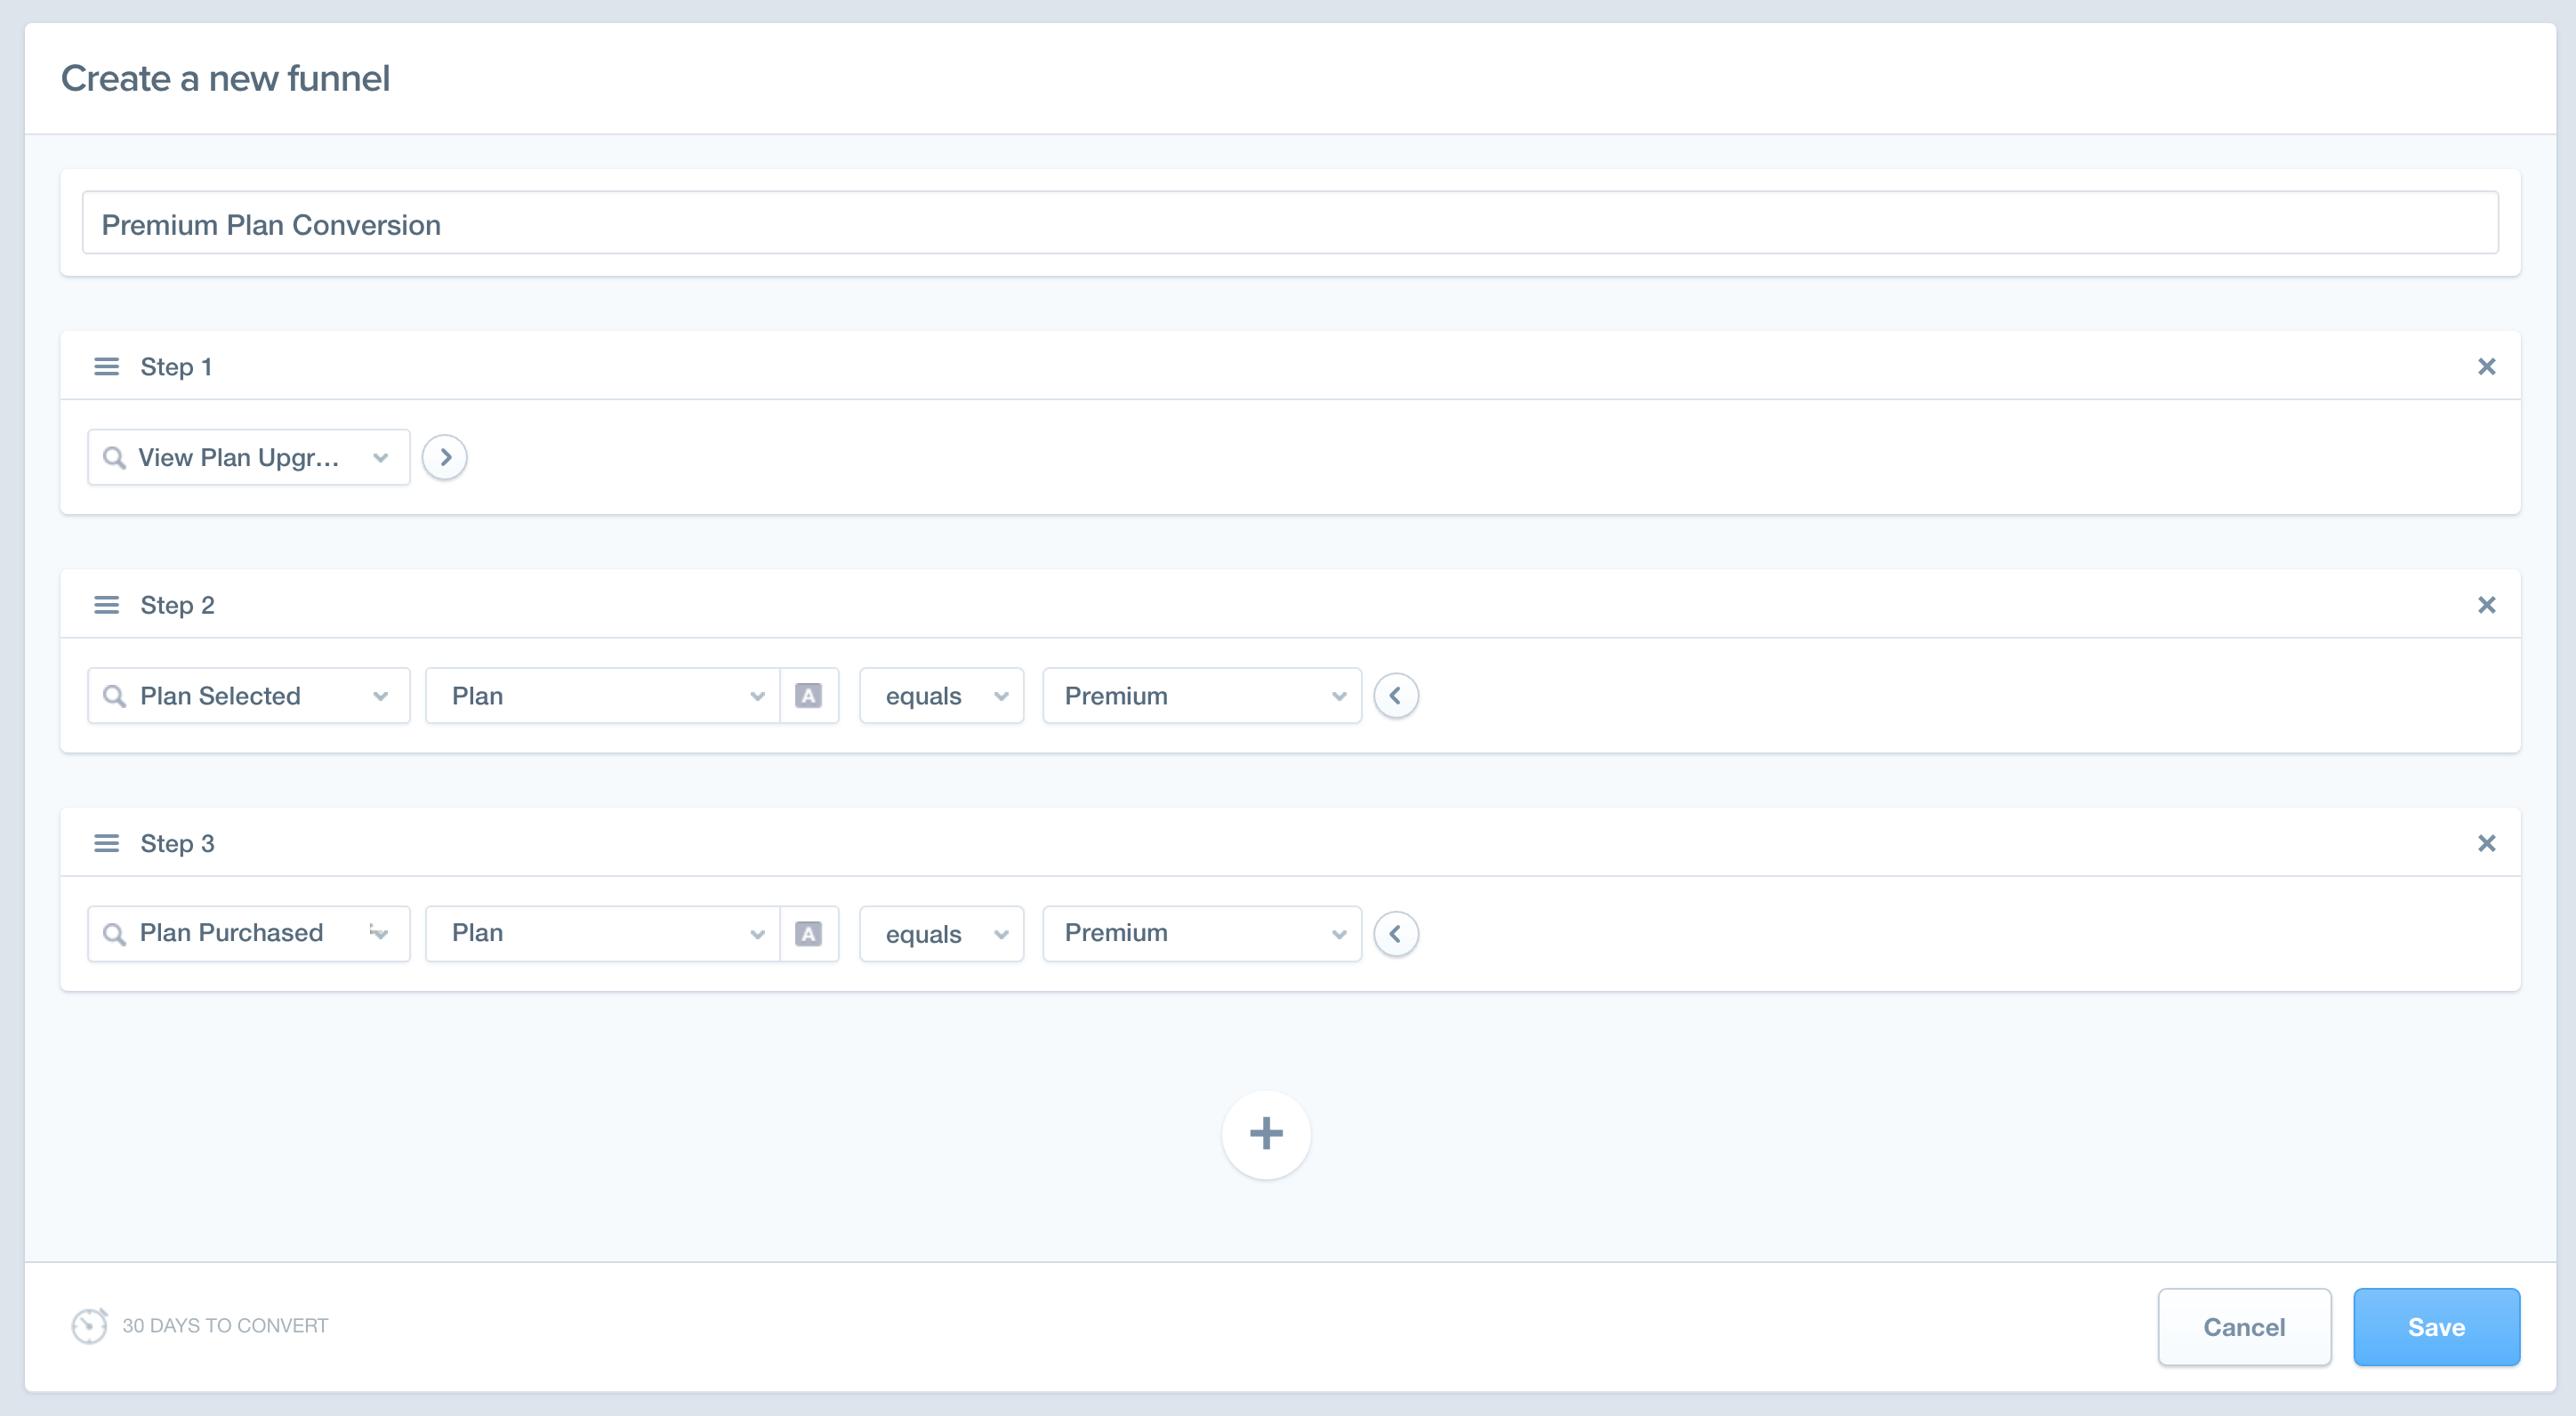
When you click the new Funnel button, notice the spaces where you can define steps in the sequence you wish to track. Figure 2 represents how you might fill out this form to track the premium plan rate conversions for the example defined earlier. The steps follow the same order of events that a user goes through in the application. The idea is that with this funnel, you get to see the conversion rate for each step in the flow. In this case, you see the conversion rate from viewing a plan to selecting a plan and, additionally, you see the conversion rate of users who select a plan and then make that purchase. Furthermore, you get global insights into the overall conversion rate from viewing to purchasing. If you want to go even more global then that, you could change Step 1 to something like “App Session” and your global metrics would change to “of all users who open the app, how many convert to a premium plan?”
Once you've chosen the appropriate steps, click Save. When a funnel is created, it retroactively looks at all the event data already tracked in the system. If you have the events set up appropriately, you immediately see the results of the created funnel. In the case of the example scenario, Figure 3 shows what the funnel input from Figure 2 might generate.
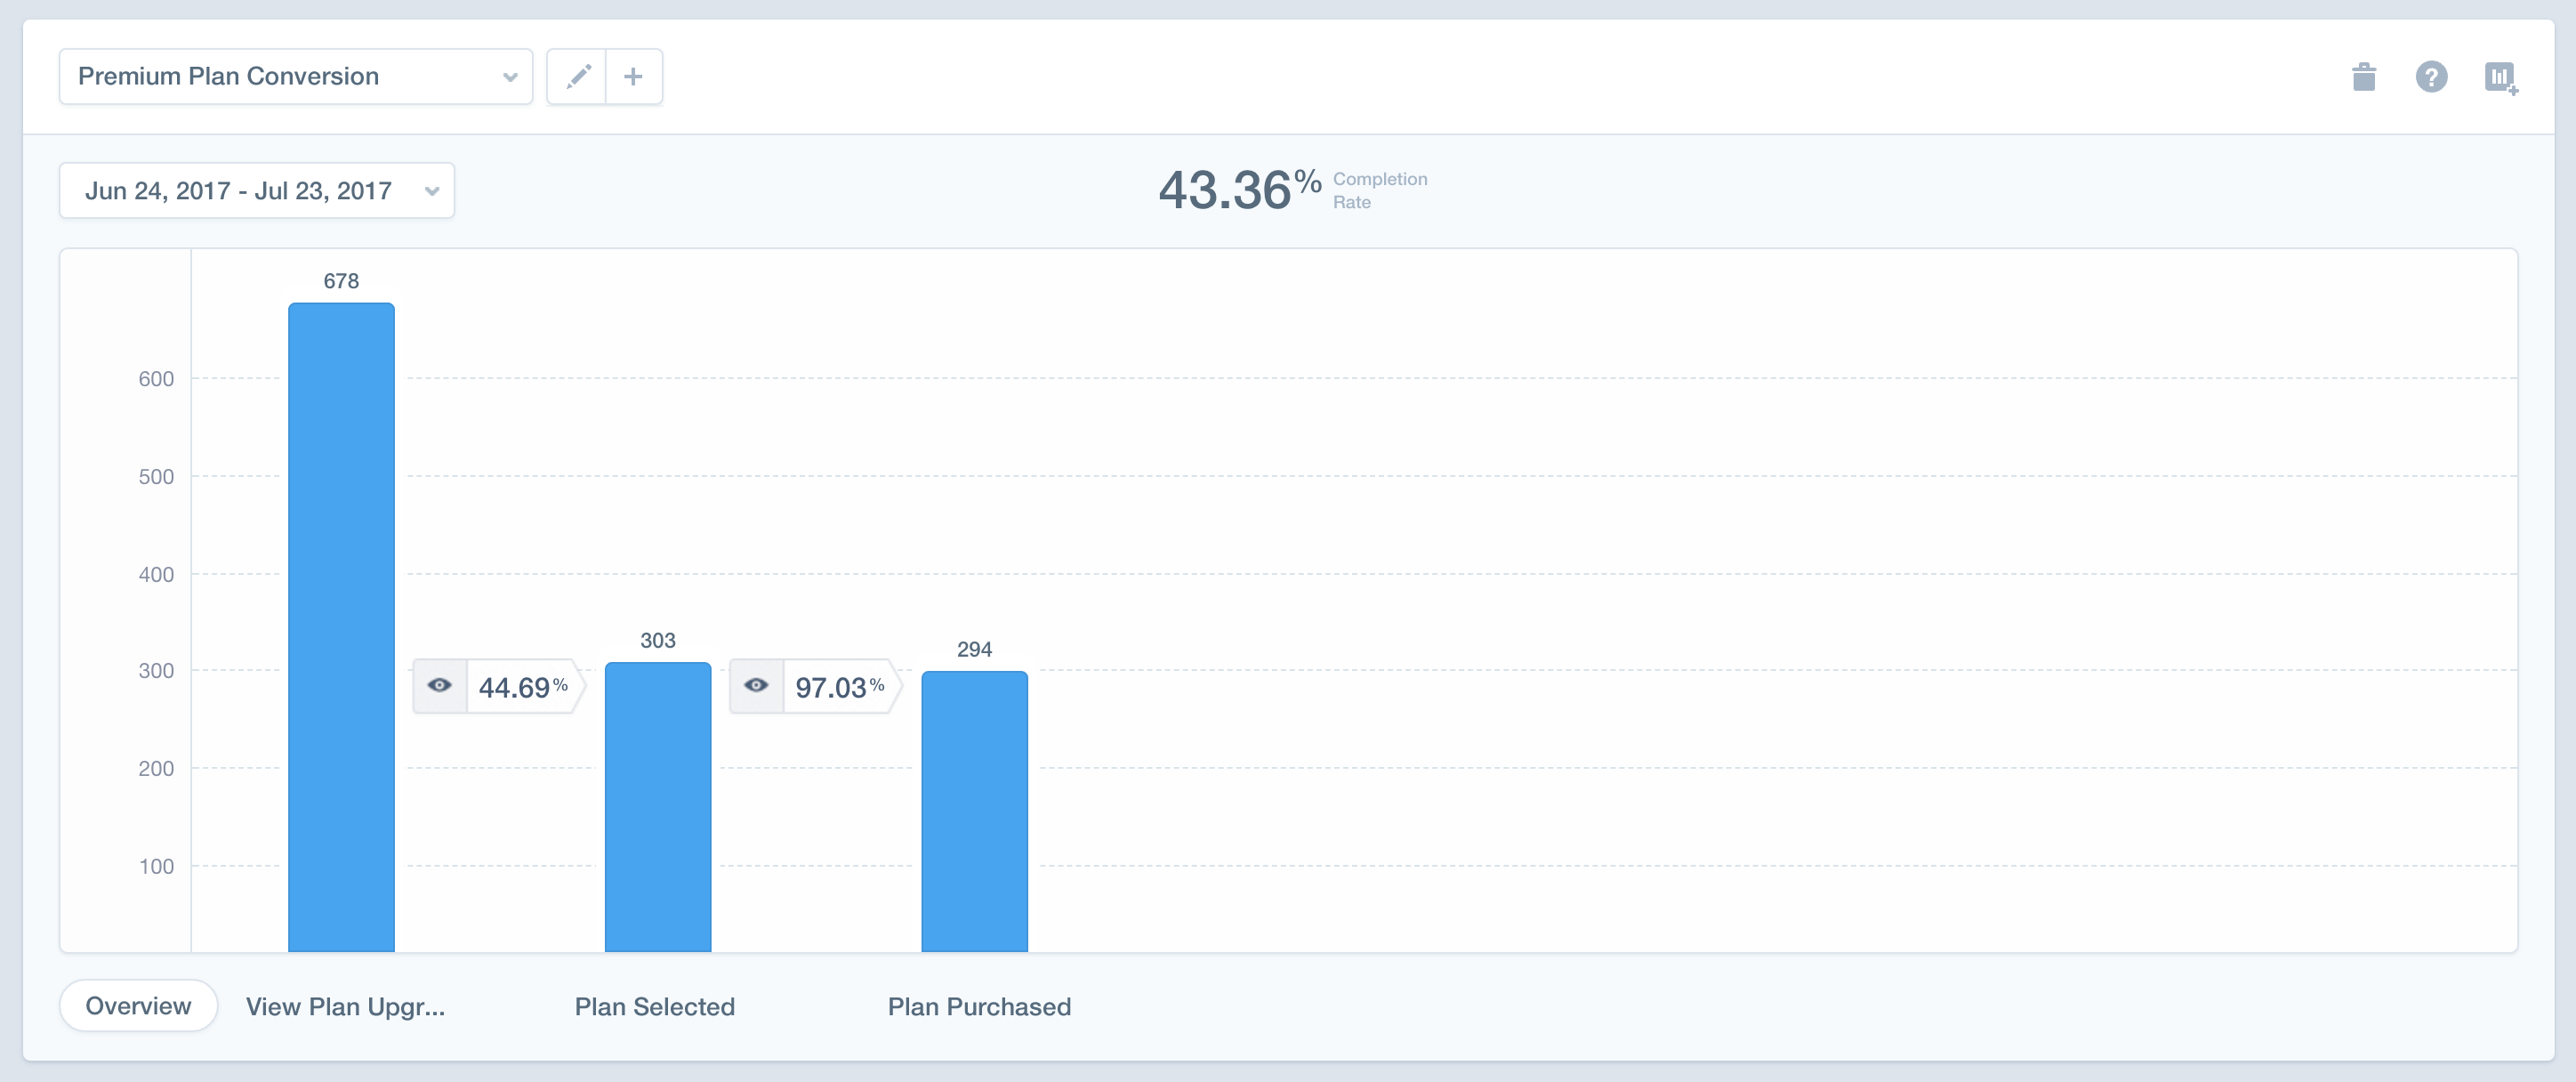
In Figure 3, you can see three blue bars, one for each step in the funnel. Notice that the number at the top shows 43.36%. This indicates the total conversion for this funnel, which, in this case, is the percentage of people who purchase a paid premium plan after viewing the plan options. You can also filter this data by date. This way, if you alter your sales pitch in the software or ramp up your marketing for premium subscriptions, you can compare your conversion rates over time to judge the effectivity of your actions. The blue bars themselves represent user numbers. Figure 3 shows that 678 people viewed the plan upgrade options between June 24 and July 23. Of those 678 users, 44% (303) selected the premium option on that screen. Of the 303 users that selected the premium option, 97% (294) converted and finished the transaction.
Funnels provide a strong indication of the effectiveness of your software anywhere there is a clear path of action for the user. Additionally, it's easy to see where the pain points might be in your user experience. For instance, let's say you have a signup or onboarding process that consists of four or five steps and you have been getting user reviews that the process isn't intuitive. You could create a funnel process from start to finish and chances are that at one of the steps in the process, you'll notice a sharp drop-off in conversion. Using this insight, you can focus your efforts on improving aspects of the software that need it, removing the tedious guesswork that can often inflate budgets and ruin timelines.
Pricing
Mixpanel has a free tier offering to help you get started with the service. This free tier offers 20M data points monthly but is restricted to a 60-day rolling history, limited reports/features, and only three team members. The People Analytics service is a separate offering but also has a free tier that grants you 1,000 user profiles.
Mixpanel has a free tier to help get you started, offering 20M data points monthly with a 60-day rolling history.
The next step up is Mixpanel's Startup plan. It's $99/month and it grants 1M data points. This is less data then the free tier but it comes with a 12-month history of data, 10 team members per project, unlimited saved reports, and predictive analytics. If you also wish to track user profiles, the second tier of that service is $150/month for 50,000 profiles.
Mixpanel offers an Enterprise-level plan as well. This plan is billed annually at $999/year, which starts you at 10M data points, a five-year data history, and unlimited members. It also adds CSV exports, custom analytics apps, unlimited custom events, and data management features not included in the other two options. There's no enterprise-level offering for the People Analytics service, so I assume that the monthly cost just scales as you exceed 50,000 profiles.
Wrapping Up
Hopefully, over the course of this article, you gained a broad understanding of Mixpanel's service. Using this service or another like it helps you maximize conversion and engagement with your users, while providing you with invaluable feedback to help steer your development efforts in the right direction.
If you're interested in a more complex breakdown of Mixpanel's offerings, be sure to visit Mixpanel.com for full API and SDK documentation. The sidebars for this article have links to additional resources that may be of use as well.