


Even with all the new features in the Microsoft SQL Server Business Intelligence (BI), sometimes the only way to accomplish a task is with good old fashioned T-SQL code. (Fortunately, “code” is the acronym for this great magazine!) In this latest installment of The Baker’s Dozen, I’ll present 13 T-SQL programming tips that could help you accomplish different database tasks.
What’s on the Menu?
Getting right to the point, here are the 13 items on the menu for this article:
- A T-SQL example that allocates data in one table based on percentages from another table, where you might learn an unexpected lesson about data types.
-
The Baker’s Dozen Spotlight: A T-SQL example that uses the MERGE statement in a data warehousing scenario. - A T-SQL example that performs the equivalent of a MEDIAN function.
- A T-SQL example that queries SQL Server system tables to retrieve specifics about snapshots.
- A T-SQL example to demonstrate the difference between identity columns and GUID columns.
- A T-SQL example to show different ways to perform queries using partial text searches, and how to use SQL Server tools to evaluate performance.
-
The Baker’s Dozen Potpourri: An example of T-SQL Ranking and Aggregation and the dangers of trying to accomplish everything in one query. - An example of using PIVOT where the spreading element is dynamic.
- Determining a Percentile over a range of values.
- A potential “gotcha” when performing a WHERE with an OUTER JOIN.
- Manually setting an identity column.
- Performing a rollback on a TRUNCATE.
- Creating a Date Dimension.
The Demo Database for the Examples
With just a few exceptions, the examples use the AdventureWorks2008R2 database. You can find AdventureWorks2008R2 on the CodePlex site. If you’re still using SQL Server 2008 and not 2008R2, the examples will still work - you’ll just need to change any 2008R2 references to 2008.
Tip 1: Performing an Allocation
Suppose you receive budget data at the region level, and you need to allocate it downward to the market or account level, based on each market/account’s percentage of share of the region. This scenario occurs in data warehouse scenarios where a developer must allocate a measure based on some weighted %. The developer needs to be careful, not only to implement the allocation method correctly, but also to ensure that the sum of the allocated numbers equal the original sum of the measure being allocated.
Listing 1 shows an example, using the AdventureWorks2008R2 database. The example uses the tables Purchasing.PurchaseOrderHeader and Purchasing.PurchaseOrderDetails, and allocates the freight from the order header table down to the product line items in the order detail table, for each purchase order. Stated simply, if order A has $100 in freight, and order A has two line items (1 and 2) with line items order dollars of $500 and $1,500 respectively, then line item 1 would receive $25 of the freight and line item 2 would receive $75 of the freight. This is because line item 1 had 25% of the total order dollars and line item 2 had 75% of the line item dollars.
This certainly seems simple enough - determine each line item allocation ratio (LineItemRatio) by taking the line item dollars (OrderQty * UnitPrice) and dividing by the SubTotal of order dollars in the order header table.
(OrderQty * UnitPrice)
  / POH.SubTotal as LineItemRatio
After that, you would take the LineItemRatio and multiply by the Freight, to determine the allocated freight for each line item. Then you’d sum all the allocated freights (which would sum to $1,583,807.6975) and compare that to the sum of freight in the order header table ($1,583,978.2263). But that’s off by roughly $170!
Now, one might argue that the difference is insignificant - after all, $170 is roughly a hundredth of a percent of the 1.5 million in total freight. However, it’s possible that accountants might require (with good reason) that the numbers either match or are within a few pennies. So are we off by $170 because of simple rounding?
It’s actually a bit more complicated. The culprit here is the money data type. The UnitPrice in the order detail table is stored as a money data type, which has a fixed scale of four decimal positions. Therefore, any ratio that we derive from a money data type will also contain four decimal positions. This means that the sum for allocated freights (for any one order) will differ from the original order freight by several cents or possibly a few dollars. When you aggregate that difference across thousands of orders, you have the explanation for the difference of $170.
The solution is to cast the result of the numerator (OrderQty * UnitPrice) as a decimal or a floating point data type, or simply multiply the numerator by 1.0 to force a cast, like so:
(OrderQty * UnitPrice) * 1.0
     / POH.SubTotal as LineItemRatio
 Cast( (OrderQty * UnitPrice) as float)
     / POH.SubTotal as LineItemRatio
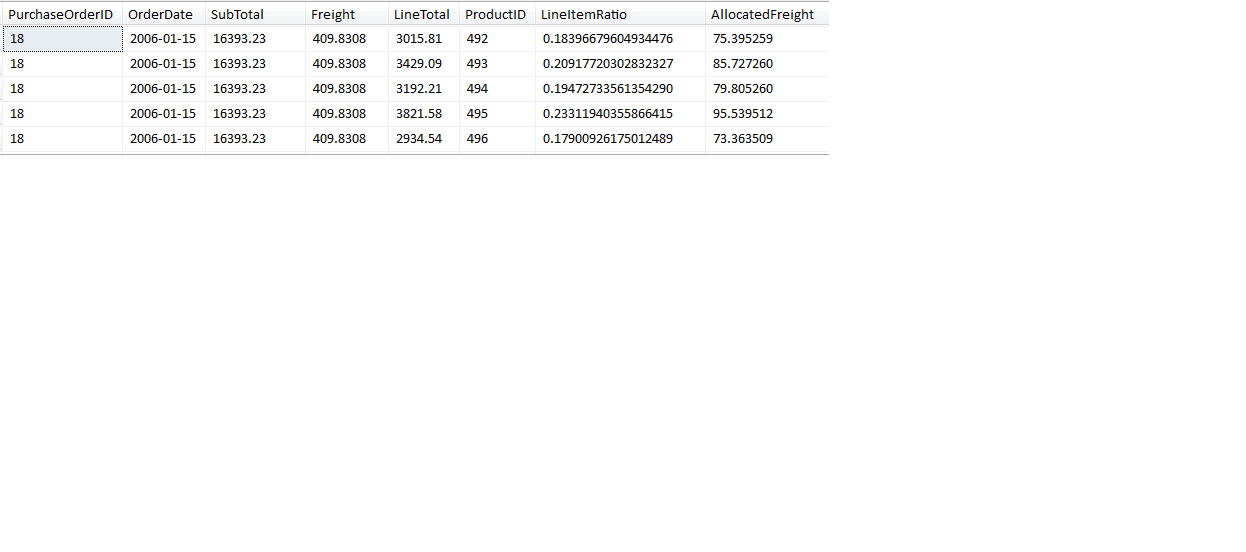
Figure 1 shows a partial result with the allocation ratio going well beyond four decimals. When we apply this logic, the difference across all orders is down to 0.000077 of a penny! I challenge anyone to come closer than that!
Tip 2: The Baker’s Dozen Spotlight - Using the MERGE Statement
SQL Server 2008 incorporated a new MERGE statement that allows developers to perform an INSERT and UPDATE (and even DELETE) in one single statement. Some developers jokingly refer to this as an “UP-SERT”.
Developers who build multiple stored procedures in OLTP applications to handle separate INSERT and UPDATE processes can reduce the number of procedures by using a MERGE statement instead. Developers in data warehousing scenarios can use MERGE on bulk loads where (for example) 75% of the input data is new data and 25% is updates.
Developers in data warehousing scenarios can use MERGE on bulk loads where maybe 75% of the input data is new data and 25% is updates.
Listing 2 shows an example of the MERGE statement to insert/update the Sales.CurrencyRate table in AdventureWorks, from a temporary staging table called TempImportCurrencyRates. In this scenario, suppose a prior process populated TempImportCurrencyRates from an external source, where the table contains currency exchange rates by source currency code, destination currency code, and exchange rate date. The table might predominantly contain new exchange rates, but perhaps some corrections as well. We need to populate the production Sales.CurrencyRate table from the Temp table by inserting new rows and updating existing rows if the rates actually changed (we wouldn’t want to execute updates if rates didn’t actually change).
We begin the MERGE by specifying the “target” table (the table we want to insert or update) and an “incoming source” table (in the using clause). The source table can also be a derived table from a SELECT query. Notice that we must specify the equivalent of a JOIN ON clause to set the stage for update criteria.
  MERGE Sales.CurrencyRate as T
    using [dbo].[TempImportCurrencyRates] as S
       on T.CurrencyRateDate =
              S.CurrencyRateDate and
         T.FromCurrencyCode =
              S.FromCurrencyCode and
         T.ToCurrencyCode =
              S.ToCurrencyCode
If any rows are in the source but not in the target, we can issue a WHEN NOT MATCHED clause to insert the source rows into the target:
  when not matched
    then insert (CurrencyRateDate,
                 FromCurrencyCode,
                 ToCurrencyCode,
                 AverageRate,
                 EndOfDayRate)
   values (S.CurrencyRateDate,
           S.FromCurrencyCode,
           S.ToCurrencyCode,
           S.AverageRate,
           S.EndOfDayRate)
If any rows are in both the source and the target (based on the ON clause at the top of the MERGE) we can issue an update, if either the AverageRate or EndOfDayRate changed.
when matched and
     (S.AverageRate <> T.AverageRate OR
      S.EndOfDayRate <> T.EndOFDayRate )
 then update set T.AverageRate =
                     S.AverageRate,
                 T.EndOfDayRate =
                     S.EndOfDayRate
Note that the MERGE statement only permits one WHEN MATCHED statement.
Finally, if we want to redirect all the inserts and updates to a table variable, we can utilize the OUTPUT statement and the system $ACTION statement.
OUTPUT $Action into @MergeActions ;
From there we can read the @MergeActions table variable to count the number of INSERT and UPDATE actions.
Tip 3: Determining MEDIAN Average
One of my major pet peeves is when people abuse a straight average when attempting to analyze a set of data/observations. A straight average (otherwise known as a mean average) does not take into account any anomalies (also known as outliers). I joke that it’s no wonder a straight average is called a mean average, because abuse of this function is downright mean!
A statistical companion to a mean average should always be a median average, which helps to give us a clearer picture of observations “in the middle”.
A statistical companion to a mean average should always be a median average, which helps to give us a clearer picture of observations “in the middle.” For instance, suppose we have 14 test scores. Nine of the 14 test scores are 80% or higher, and five people failed the test (with four failing badly).
100
100
95
93
92
90
90
88
81
65
30
30
25
20
The overall mean average would be roughly 71%. OK, some of the scores here are very low, but over half the scores are above 80%. Can we determine a better average that isn’t as mitigated by the outliers at the bottom? Again, that is the purpose of the median average - unfortunately, TSQL does not contain a MEDIAN average.
Fortunately, it isn’t difficult to create a MEDIAN average - if we rank the test results using the T-SQL ROW_NUMBER function, determine the # of rows, and retrieve the score in the middle (or take a straight average of the two scores in the middle if we have an even number of scores), that will give us a median average (in this case, an 89%).
Special Note: Several SQL authors and Microsoft MVPs have discussed this topic and different techniques in their books and blogs, most notably Aaron Bertrand, Itzik Ben-Gan, Joe Celko, and Adam Machanic.
Listing 3 provides the complete code for this process. The use of the ROW_NUMBER function is straightforward - to generate a unique ranking number for each observation. What isn’t quite as clear is the WHERE clause against the generated rank:
    WHERE ( ScoreRank IN ((@NumObservations+1)/2,
       (@NumObservations+2)/2) )
In plain English, suppose you had 13 scores - the median score would be the 7th score. Now suppose you had 14 scores - the median score would be the straight average of the 7th and 8th scores. In other words, with an even number of observations, you’d need to evaluate and average two scores.
There are multiple ways to write this. One might be to check if the number of observations is an odd or even number. Another (the way I’ve chosen here) is to create a list of two possible rankings for which to search. The first value would be the number of observations plus one, divided by 2. The second value would be the number of observations plus two, divided by 2. Since the number of observations variable is an integer, dividing by another integer will give us integer truncation, which (as it turns out) is exactly what we want.
    WHERE ( ScoreRank IN ((@NumObservations+1)/2,
       (@NumObservations+2)/2) )

 -- If @NumObservations is 14,
-- where ( ScoreRank in (  15/2 , 16/ 2)
-- where (ScoreRank in (7,8) , since 15/2 is 7
--         (when using integers)

-- If @NumObservations is 13,
-- where ( ScoreRank in (  14/2 , 15/ 2)
-- where   (ScoreRank in (7, 7)
Tip 4: Getting Information on an Open Database Snapshot
I’ll grant that this next scenario is a rather esoteric one, though the question was actually raised in a production setting. Suppose you have a user performing an update, a second user reading that same row using the snapshot isolation level, and you want to read both activities using existing system tables?
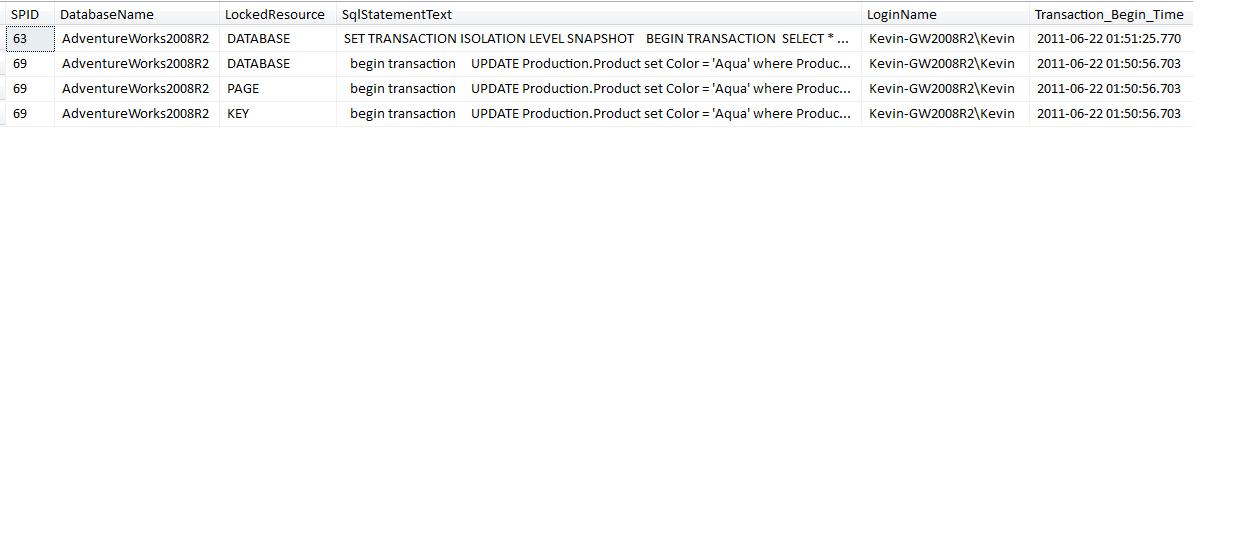
Listing 4 shows a modified example of a query that developers often find in SQL Server Books Online and other websites - a query that reads sys.dm_tran_locks and other system tables to show process IDs (SPIDs) and lock information. The system table sys.dm_tran_locks contains information on locked resources in SQL Server. However, the standard query found in SQL Server Books Online won’t show information on the snapshot read, because the snapshot isolation level utilizes row versioning and not locking; therefore, we can’t see information on the snapshot.
So if we change the query to use outer joins and if we place some filters in the WHERE clause, we can see both the lock transaction as well as the snapshot (Figure 2).
Tip 5: Identity Columns and UniqueIdentifer Columns
Some people get confused about the use of the identity column property and the uniqueidentifier data type. As uniqueidentifers are often known as GUIDs (Globally unique identifiers), I’ll refer to them as GUIDs.
First, here are the attributes of an identity column:
- You use them as a property of integer columns.
- When you define the column as a Primary Key, SQL Server will enforce uniqueness within the table.
- By default, SQL Server will always generate a new unique identity value for you. I say “by default” because you can override the default behavior and try to assign a value manually - I’ll cover this in Tip 11.
- Remember that there is no actual column data type called “identity” - it is a property of integer columns.
By contrast, here are the attributes of the GUID data type:
- It is an actual data type - a 32-character (16-byte) value.
- Unlike an identity column, SQL Server does not automatically assign a value. You must either call the NEWID() function to generate a new GUID, or you must place a NEWSEQUENTIALID() function as a column default in the table’s DDL (Data Definition).
- A GUID is guaranteed to be globally unique across all databases. That’s right - you and a dozen people could sit at your machine all day long and issue NEWID() function calls (or insert rows into a table with a GUID column that uses NEWSEQUENTIALID() as a default column value), and no one would ever generate a duplicate. This makes GUIDs ideal for generated unique identifiers across multiple physical (and separate) databases that ultimately need to be merged into one destination database.
Listing 5 demonstrates all three columns in action by creating three tables (one using identity columns, the second using a GUID with the NEWID function, and a third using a GUID with the NEWSEQUENTIALID function).
Why are there two different methods for populating the GUID column? Because the NEWID function generates a random GUID, and creates a high level of fragmentation when used as a primary key (which creates a clustered index). The NEWSEQUENTIALID function (added in SQL 2005) generates new GUIDs sequentially, and therefore creates less fragmentation. Note that you can only use NEWSEQUENTIALID in a default statement - you cannot call NEWSEQUENTIALID() by itself.
I mentioned fragmentation that occurs with the NEWID function - so how much fragmentation? The last section of Listing 5 queries the system table sys.dm_db_index_physical_stats for the level of fragmentation and the number of data pages in a table. Note the high level of fragmentation in the example that uses NEWID - also note the extremely high data page count due to page splitting that occurred from random key value generations. While a DBA can defragment a table that uses NEWID and can also use SQL Server’s FILL FACTOR to address page splitting, often the better approach is to use the NEWSEQUENTIALID function.
Tip 6: Performance with SUBSTRING vs. LIKE
Suppose you wanted to query a large database table to find all the names that began with a specific number of characters?
Let’s look at an example of two queries that try to search a large table (over 20 million names) where the last name begins with a specific number of characters. One uses the SUBSTRING function and the other uses LIKE with a ‘%’ sign at the end.
select * from TestLargeNames where
   SUBSTRING(Name, 1, 15) =
        'Name 0000000001'
select * from TestLargeNames where
    Name like
        'Name 0000000001%'
So which one performs better? The LIKE statement is a clear winner. By turning on IO STATISTICS we can see that the SUBSTRING performs far more database reads than the LIKE, and the query execution plans shows that SUBSTRING can only perform an INDEX SCAN, whereas the LIKE can perform an INDEX SEEK. So keep that in mind the next time you use SUBSTRING!
Tip 7: The Baker’s Dozen Potpourri - Ranking, Multiple Aggregations, and Filtering on Rankings
As a SQL Server instructor, I warn many students of “gotchas” in writing T-SQL queries. Sometimes developers are so intent on writing one single SELECT statement to accomplish all the result set requirements that they either produce a query that is difficult to read, or the query actually generates the incorrect results.
As an example, suppose you needed to query against a master table (a product master) and two child transaction tables (purchase orders and sales orders). You want to generate a result set of one row per product with summarized order dollars amounts from both the purchase order and sales order table. The result set should show one row for every product, regardless of whether orders existed. If you weren’t aware of this issue, you might write the following code:
SELECT PR.Name,
       SUM(PurchaseDollars) as PDollars,
       SUM(SalesDollars) as SDollars
   FROM Products PR
    LEFT JOIN PurchaseTable PT
            ON PR.ProductID = PT.ProductID
    LEFT JOIN SalesTable ST
            ON PR.ProductID = ST.ProductID
GROUP BY PR.Name
Unfortunately, this will generate incorrect results for any product with both purchase orders and sales orders - specifically, the purchase and sales dollars will be overstated. Why? Suppose you have a product that appears on four purchase order rows and six sales order rows. When you join products to purchase orders, the resulting “product” is the same product, repeated four times. Consequently, when the product is joined to the Sales Order table, the resulting “product” is used four times - thus, the resulting sales order dollar amount will be four times the actual amount. And believe it or not, the reverse occurs - the resulting product from the query between the product table and the sales order table will generate a purchase order dollar amount that will be six times the actual amount! As Scooby-Doo would say, and as I often tell my two-year-old daughter when something goes awry, “RUH-ROH**!!!”**
The correct approach is to aggregate each of the two parent-child relationships separately - this is a situation where we cannot query multiple one-to-many relationships and expect to get the correct aggregations. So you can either create two separate temp table results and then join them together, or create two sub-queries or common table expressions - the point is to aggregate each of the two child tables independently.
The correct approach is to aggregate each of the two parent-child relationships separately. This is a situation where we cannot query multiple one-to-many relationships and expect to get the correct aggregations.
Listing 6 shows an example of aggregating purchase orders and sales orders by product, and ranking the products based on Purchase Orders. In this example, we have multiple one-to-many relationships. It is an example where we must aggregate the purchase order data independently from the sales order data to avoid instances of exponential aggregation.
Listing 6 also demonstrates a solution to another issue. Suppose we want to take the results and only show the top 10 products by aggregated purchase order dollar amounts - specifically, we want to see the 10 best unique purchase order dollar amounts. Figure 3 shows the result set we want to generate - note that Front Brakes and Rear Brakes both have the same purchase order amounts, $1,594,564.125. So in this instance, they are tied for the fourth highest purchase order dollar amount. So again, we want to see the 10 best order amounts; additionally, we also want to account for ties, and we also don’t want to see any gaps after a tie. As for that last requirement, that means the next product-purchase order amount after the Front Brakes and Rear Brakes will be ranked #5.
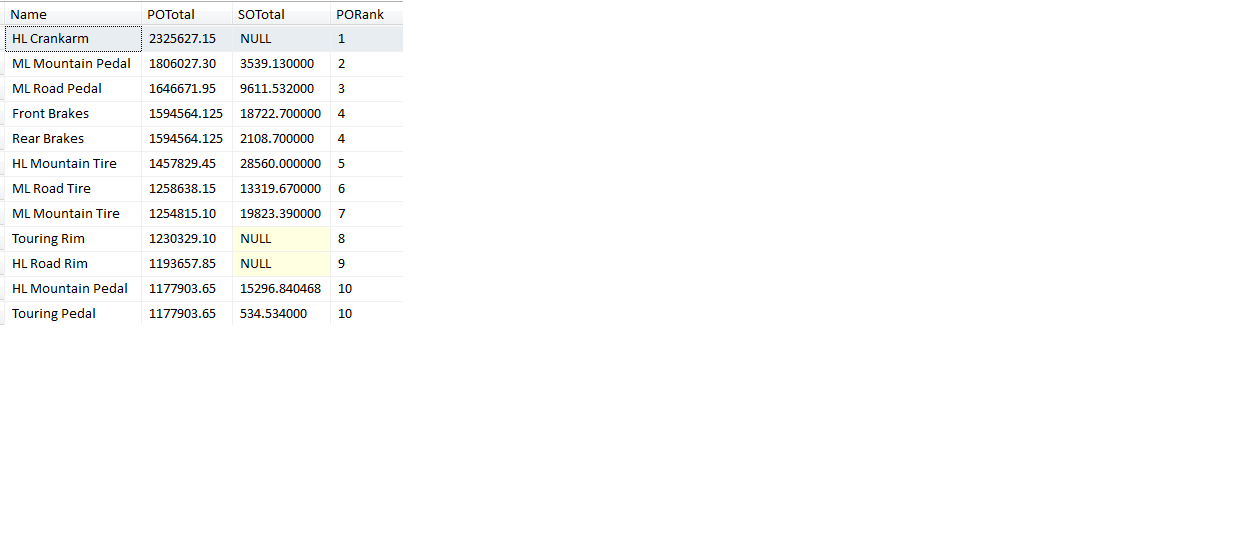
Fortunately, T-SQL provides the DENSE_RANK function (used in Listing 6), to generate a ranking number that accounts for ties and does not leave any gaps after a collection of tied amounts.
You may be thinking, “Can’t we just use a TOP 10 statement?” Think again. While a TOP (N) statement contains an optional WITH TIES, it can’t give us the desired result if we have ties before the 10th highest value. Moral of the story - the TOP (N) statement is problematic when used to filter against DENSE_RANK or any type of RANK across groups (i.e., RANK with PARTITION).
Finally, there’s one more “gotcha.” Notice in Listing 6 that I used a derived table subquery and filtered on the derived PORank outside the subquery. Why didn’t I try to filter on the PORank inside the main query that joined together the two separate aggregations? The reason is because PORank is a derived column, and the WHERE clause only works against direct table columns. When someone remembers this rule, the next question is why I didn’t just repeat the DENSE_RANK function in the WHERE clause, as some developers will do when they’re filtering on a derived calculation:
where dense_RANK() over
       ( order by POTotal DESC) <= 10
This generates an error indicating that windowed functions cannot appear in a WHERE clause. (When you think about it, the RANK functions generate a specific number for any one rule “across a window” of multiple rows, hence the term “windowed functions.” So our only recourse is to place this in a sub-query and then use a straight WHERE clause against the materialized ranking number.
Tip 8: Dynamic PIVOT with Dynamic SQL
The PIVOT statement, added in SQL Server 2005, has a major shortcoming - if the spreading element in the PIVOT statement is dynamic, we must use dynamic SQL. (The same reason applies when we have a variable number of columns in a SELECT statement, and must use dynamic SQL.)
As a result, some developers avoid the T-SQL PIVOT statement and use Reporting Services, which features a matrix capability to generate columns dynamically.
As it turns out, with a bit of dynamic T-SQL, we can overcome the limitations of PIVOT. We can construct a string that contains the query we’d like to generate, and then use dynamic T-SQL to actually execute the query by referencing the string.
For example, suppose we want to generate a result set of purchase order dollar amounts by Vendor (down the left as rows) and ship methods (across the top as columns), where we don’t know the names and ID codes of shippers. Perhaps we actually “know” the name and number of shippers, but chose not to hard code them into the query, as the list may change.
Listing 7 shows how to implement a pivot of sales by ship methods where we want to read the list of ship methods out of a table. The key is to construct a SQL statement as a string, as if we knew (at any one point in time) the actual list of ship methods.
We can use the STUFF and FOR XML PATH statements to build a string of delimited ship methods, and concatenate that with a string that issues the PIVOT statement. The FOR XML PATH is a very popular technique that SQL developers use to dynamically concatenate row values into a string. One website (http://www.simple-talk.com) credits Eugene Kogan as the originator. Finally, we can use the SQL Server system stored procedure sp_executesql to execute the code inside the concatenated string.
Tip 9: Getting Percentiles with TILE
One of the more under-appreciated TSQL functions is NTILE. This function distributes the rows in an ordered partition into a specified number of groups. For each row, NTILE returns the number of the group to which the row belongs. It is very helpful for tasks like taking all of your customers and putting them into quartiles based on their sum of sales dollars. So you might have your top 25% of customers (based on sales) in quartile 1, your next 25% based on sales into quartile 2, etc.
Most people understand the concept of ranking data within percentiles. For instance, my daughter is now two years old, and is in the 55th percentile for height and 48th percentile for weight. The percentiles were derived from placing all weight and height observations into 100 tiles, with an even number of observations in each tile. We can see the same thing in the following code:
;WITH OrderCTE AS
   (select distinct totaldue
       from sales.SalesOrderHeader)

SELECT TotalDue,
     NTILE(100) over
         (order by TotalDue desc) as
    Percentile  FROM OrderCTE
In the code, I retrieved a distinct list of total due amount values, and then used NTILE with a parameter of 100. This distributes the 4,754 unique values evenly across 100 groups. As a result, we can see that any order between $27,128 and $28,554 is in the 29th percentile, and any order between $184,487 and $114,690 is in the very top percentile.
Tip 10: Performing a WHERE with an OUTER JOIN
It’s time for another GOTCHA! Recently I helped an experienced developer with an issue that he wasn’t aware of. His example was a very specialized one, so I’ll use AdventureWorks as an analogy. Suppose we want to show all vendors, regardless of whether they have sales or not, and then show the summarized sales dollars for 2008.
The first part of Listing 8 shows initially how some people (and my developer friend) might implement this: using an OUTER JOIN and a WHERE on the child table. Unfortunately, the WHERE negates the effect of the outer join, giving us far fewer vendors than we expected! Effectively, we get the same results that we’d get if we performed an INNER JOIN, and that wasn’t the original objective.
However, later in Listing 8, if we localize the criteria against the child table in the ON statement, or if we place the criteria in a common table expression and then perform an outer join against the Vendors, then we generate the desired result set - a list of all vendors and their summarized order amounts (or NULL for any vendors who didn’t have sales).
Tip 11: Manually Setting an Identity Column
Most data warehousing professionals will tell you (and rightly so) that you should never store NULL values in a foreign key. For instance, suppose you have an order table with a cost center foreign key (that relates to a cost center key in a cost center master table). In this scenario, suppose that 95% of orders have a valid cost center, but 5% either don’t have a cost center (or perhaps the cost center is viewed as “unclassified”).
~While some might be tempted to store a NULL for the unknowns in the Cost Center foreign key, the recommended approach is to store a value for an “unknown/unclassified” cost center in the cost center master. Users will be able to report on an unclassified cost center, and a DBA can later merge some of the unclassified cost centers to a valid cost center if it’s later determined that some of the transactions actually had a valid cost center.
Now suppose the Cost Center master has an identity key used as a primary key - and you want to insert a “dummy” value of -999 for the unknown/unclassified value? Remember that, by default, SQL Server generates an identity column value, and you can’t change it. I say “by default” because SQL Server has a setting called IDENTITY_INSERT that is set OFF by default (the “OFF” refers to us - basically, the identity column is off-limits for us to set). However, you can briefly change this setting and manually add an identity value yourself.
Listing 9 shows how to do so, if you need to manually override an identity column to insert an unknown value. I tell people that you should use the IDENTITY_INSERT setting only when no one else is using the table and you should treat it as an “open the door, do what you need to do quickly, and then shut the door and lock up again.” In other words, set IDENTITY_INSERT to a value of ON, insert the manual entry, and then set IDENTITY_INSERT back to OFF.
Also note that if you’ve created a primary key with a clustered index on the table, the -999 value will always sort to the top of the table.
Tip 12: Performing a Rollback on a TRUNCATE
Want to (maybe) have some fun with someone? Ask the person if you can roll back from a TRUNCATE TABLE statement in a SQL transaction. Many might say no, figuring that a TRUNCATE TABLE statement does not log the deletion of rows, but instead de-allocates the data pages used to store the table’s data.
Believe it or not, you CAN issue a rollback statement in a SQL transaction, and recover a table from a previous TRUNCATE statement in the transaction. Listing 10 briefly demonstrates the steps.
So how does it work if SQL Server isn’t logging the row deletions? As it turns out, SQL Server DOES log the page de-allocations. So SQL Server is able to reverse that and restore the data.
Note that this can ONLY occur in a SQL transaction. If you attempt a rollback statement without a previously executed BEGIN TRANSACTION, SQL Server will generate an error.
Tip 13: Creating a Date Dimension
Many developers try to derive data parts/definitions on the fly using queries and/or reusable functions.
Another approach is to build a date calendar that pre-defines week ending dates, months, quarters, years (both fiscal and calendar), and any other date period information. We can also use it to store seasonality attributes like Lent Week or the week of “Black Friday” (the shopping day after Thanksgiving). That way, users can retrieve data by Lent Week or Black Friday across years, where the date varied by year (two examples of seasonality).
Many developers try to derive data parts/definitions on the fly using queries. Sometimes it might be better to build a date calendar that stores week ending, month, quarter, year, and any other date period information. We can also use it to store seasonality attributes like Lent Week.
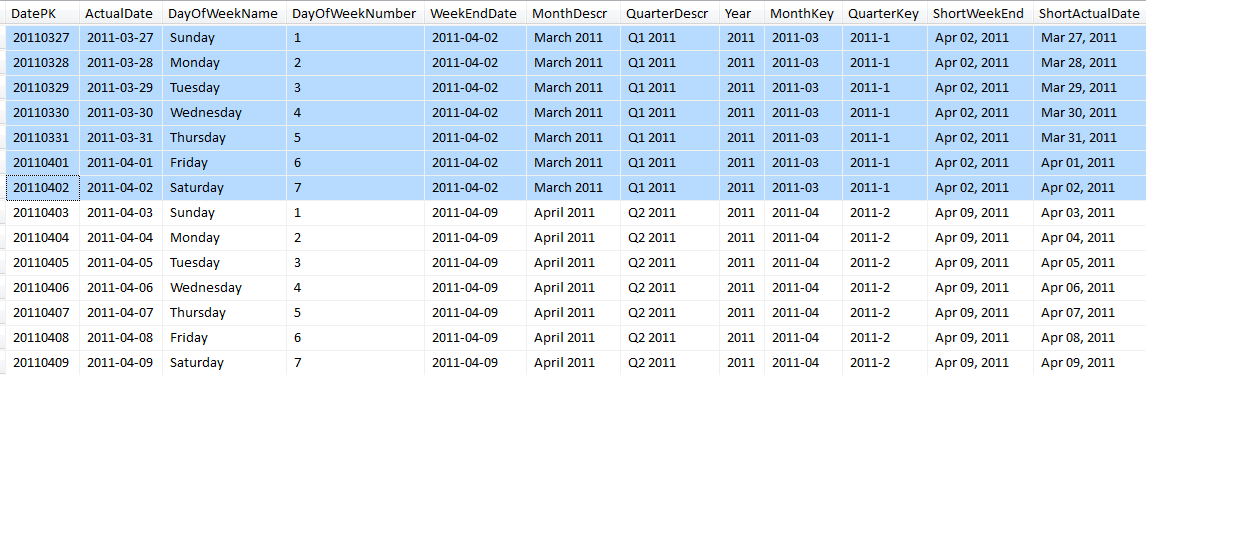
Listing 11 shows T-SQL code to create a date dimension master table (where a partial list of results can be found in Figure 4). There isn’t anything overly complex about creating a date dimension table other than the extensive use of date parts. However, the code does illustrate the following (in no order of importance):
- Note the pairs of columns for MonthKey and MonthDescr (and QuarterKey/QuarterDescr) - this allows developers to display a Month description, yet sort chronologically on the corresponding Key value (unless, of course, you’d actually “prefer” April and August to come before January!)
- Note the block of code that sets a Saturday date if you want to summarize data by week ending date. The logic takes the day number of the week, subtracts it from 7, and adds the result to the date. Most (but certainly not all) weekly business calendars are Sunday to Saturday. If you have a different date range, you’ll need to use the SQL Server @@DateFirst setting.
- Also note that all code blocks that add a number of days are using the DATEADD function. Some developers prior to SQL Server 2008 would use the + operator (e.g. SET @NewDate = @OldDate + 1). In SQL Server 2008, you cannot use the + operator with the new DATE data type - you MUST use DateAdd.
- Note in Figure 4 that Friday April 1 is part of March and part of Quarter 1. This is to demonstrate a scenario where a company might view that entire week as part of March, because more days in the business week fell under March, compared to April. By determining the Wednesday day (note the variable @MidWeek), we can place the date into the month and quarter we want for any reporting. (If you simply viewed April 1 as part of April and Quarter 2, regardless of the day of the week, you’d assign the month and quarter and even year based on the current date, not the @Midweek date).
This entire process allows developers to store the DatePK (which is a four-byte integer) in any fact transaction tables, which is more efficient than storing a date. It also allows developers to join fact transaction tables to this Date dimension table, to summarize data by any column in this date dimension table.
Une Autre! (Encore)
The original idea of “The Baker’s Dozen” was to give 13 items for the price of 12. Well, I often want to do a little more than expected, so I’ll add one more tip and make it an even 14!. (If you’re curious, Une Autre is the literal French translation for “encore”.)
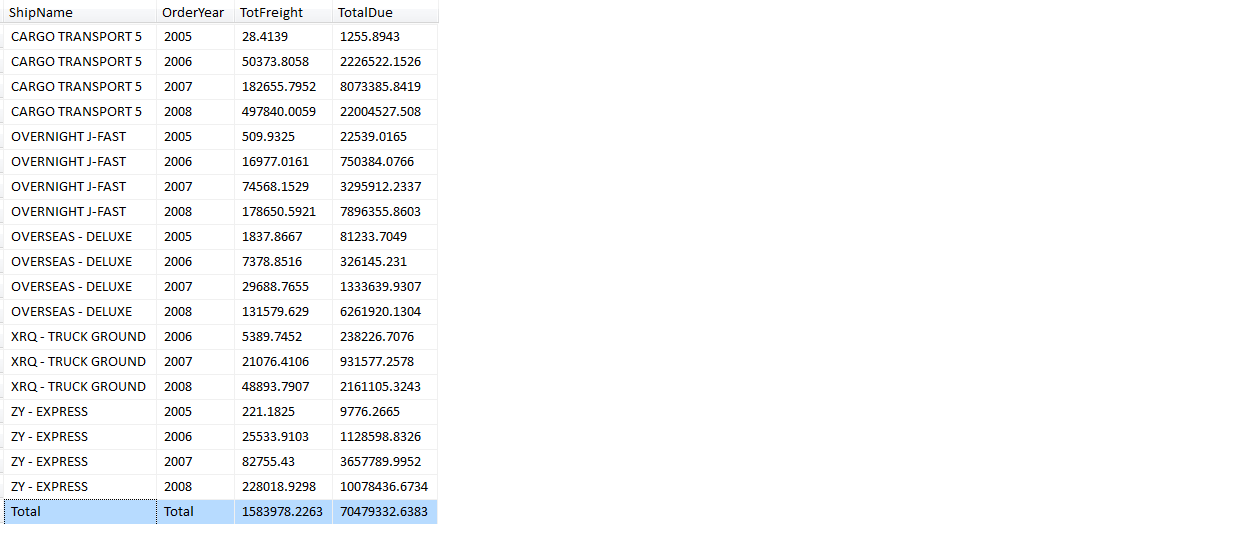
Have you ever wanted to produce a total row in a result set? Prior to SQL Server 2008, most SQL developers accomplished this with a UNION and a subsequent SELECT that aggregated all the relevant columns. Listing 12 shows an alternate method in 2008, using the GROUPING SETS clause to summarize not only by Ship Method and Year, but also for a grand total (Figure 5).
If you’re not familiar with GROUPING SETS, it is a GROUP BY extension that makes prior GROUP BY extensions (GROUP BY ROLLUP and GROUP BY CUBE) unnecessary. GROUPING SETS allows the developer to specify specific sets of groups (thus the name of the clause).
Also note the use of the GROUPING function in the SELECT, to transform any resulting NULL values in the grand total row to a text description (“TOTAL”). In the case of the Order Year, it’s necessary to cast the order year as a character; otherwise, you wouldn’t be able to have the order year (as an integer) share the same column as the world “total”.
Book Recommendations
There are many good Transact-SQL books on the market. Two I can strongly recommend are the following:
Microsoft SQL Server 2008 T-SQL Fundamentals, by Itzik Ben-Gan (Microsoft Press)
SQL Server 2008 Transact-SQL Recipes, by Joseph Sack (Apress)
If you’re looking for a good book on the internals of SQL Server, here’s a perfect book:
Microsoft SQL Server 2008 Internals, by Kalen Delaney (and Paul Randal, Kimberly Tripp, Conor Cunningham, and Adam Machanic) (Microsoft Press)
Listing 1: T-SQL code to perform an allocation
use AdventureWorks2008R2
go
select sum(Freight) as HeaderFreightSum from
                     Purchasing.PurchaseOrderHeader

select *, LineItemRatio * Freight as AllocatedFreight from
   (select POH.PurchaseOrderID,
            cast(POH.OrderDate as DATE) as OrderDate,
            SubTotal, Freight, LineTotal, POD.ProductID,
            (OrderQty * UnitPrice) * 1.0  / POH.SubTotal
                                  as LineItemRatio
          FROM Purchasing.PurchaseOrderHeader  POH
            JOIN Purchasing.PurchaseOrderDetail POD ON
                poh.PurchaseOrderID =
                pod.PurchaseOrderID ) TempAlias
ORDER BY PurchaseOrderID
COMPUTE sum( LineItemRatio * Freight)
Listing 2: Using the MERGE statement
use AdventureWorks2008R2
go
CREATE TABLE [dbo].[TempImportCurrencyRates](
   [CurrencyRateDate] [datetime] NOT NULL,
   [FromCurrencyCode] [nchar](3) NOT NULL,
   [ToCurrencyCode] [nchar](3) NOT NULL,
   [AverageRate] [money] NOT NULL,
   [EndOfDayRate] [money] NOT NULL
) ON [PRIMARY]


CREATE PROCEDURE [dbo].[MergeTempCurrencyRates]
AS
BEGIN

  DECLARE @MergeActions TABLE   (  ActionName varchar(10) )

  MERGE Sales.CurrencyRate as T
     using [dbo].[TempImportCurrencyRates] as S
            on T.CurrencyRateDate = S.CurrencyRateDate and
               T.FromCurrencyCode = S.FromCurrencyCode and
               T.ToCurrencyCode = S.ToCurrencyCode
     when not matched
              then insert (CurrencyRateDate, FromCurrencyCode,
                           ToCurrencyCode, AverageRate,
                           EndOfDayRate)
              values (S.CurrencyRateDate, S.FromCurrencyCode,
                           S.ToCurrencyCode, S.AverageRate,
                           S.EndOfDayRate)

     -- we can't have multiple WHEN MATCHED statements that would
     -- read columnA for a change, and then columnB for a change
     when matched and (S.AverageRate <> T.AverageRate OR
                       S.EndOfDayRate <> T.EndOFDayRate )
          then update set T.AverageRate = S.AverageRate,
                          T.EndOfDayRate = S.EndOfDayRate

   OUTPUT $Action into @MergeActions ;

   -- bring back the # of insertions and the # of updates,
   -- so that the SSIS execute task can read them into 2 variables

   DECLARE @NumInserts INT, @NumUpdates INT
   SET @NumInserts = (select COUNT(*) FROM @MergeActions
                         WHERE ActionName = 'INSERT')
   SET @NumUpdates = (SELECT COUNT(*) FROM @MergeActions
                         WHERE ActionName = 'UPDATE')

   SELECT @NumInserts as NumInserts, @NumUpdates AS NumUpdates
END
Listing 3: Determining the median average
DECLARE @StudentScore  TABLE (Id int, Score int)

INSERT INTO @StudentScore VALUES
   ( 1, 100),  ( 2, 100),  ( 3, 95 ), ( 4, 93),   ( 5, 92),
   ( 6, 90),   ( 7, 90),    ( 8, 88),  (  9, 81),  (  10, 65),
   ( 11, 30),  (  12, 30),  ( 13, 25),  (  14, 20)

DECLARE @NumObservations int = @@ROWCOUNT

;WITH ScoreCTE AS  (
       SELECT Id, Score,
       ROW_NUMBER() OVER (ORDER BY Score) AS ScoreRank
          FROM @StudentScore)

SELECT AVG(Score)  AS Median FROM ScoreCTE
    WHERE ( ScoreRank IN ((@NumObservations+1)/2,
       (@NumObservations+2)/2) )
Listing 4: Getting information on an open snapshot
-- User A begins a transaction and updates a row

use AdventureWorks2008R2
go

begin transaction
   UPDATE Production.Product
          set Color = 'Aqua' where ProductID = 316
-- leave it pending

-- User B reads using the snapshot isolation level
SET TRANSACTION ISOLATION LEVEL SNAPSHOT

BEGIN TRANSACTION
SELECT * FROM PRODUCTION.Product WHERE ProductID = 316

-- Suppose you want to know information on both open process IDs?

SELECT
 L.request_session_id AS SPID,
        DB_NAME(L.resource_database_id) AS DatabaseName,
        L.resource_type AS LockedResource,
        ST.text AS SqlStatementText,
        ES.login_name AS LoginName,
         at.Transaction_Begin_Time
FROM            sys.dm_tran_locks L
  left JOIN sys.partitions P
          ON P.hobt_id = L.resource_associated_entity_id
  left JOIN sys.objects O
          ON O.object_id = P.object_id
  left  JOIN sys.dm_exec_sessions ES
           ON ES.session_id = L.request_session_id
  left JOIN sys.dm_tran_session_transactions TST
           ON ES.session_id = TST.session_id
  left JOIN sys.dm_tran_active_transactions AT
           ON TST.transaction_id = AT.transaction_id
  left JOIN sys.dm_exec_connections CN
           ON CN.session_id = ES.session_id
  cross APPLY sys.dm_exec_sql_text(CN.most_recent_sql_handle) AS ST

WHERE   resource_database_id = db_id()
and is_user_transaction = 1 and (o.name is not null or
    l.resource_type = 'Database')
Listing 5: Identity columns and UniqueIdentifer columns
CREATE TABLE IdentityTest1
  (IdentityColumn int identity(1,1)  PRIMARY KEY,
   TestName varchar(25))

CREATE TABLE IdentityTest2
   (GUIDRandom uniqueidentifier default newid() PRIMARY KEY,
     TestName varchar(25))

CREATE TABLE IdentityTest3
    (GUIDSequential uniqueidentifier
                   default newsequentialid() PRIMARY KEY ,
      TestName varchar(25))
GO

set nocount on
DECLARE @Counter int = 1
DECLARE @NewName varchar(25)

while @Counter <= 1000000  -- One million rows
   BEGIN
       set @NewName =  'Name ' +
                RIGHT( '0' + CAST(@Counter as varchar(2)),2)
          INSERT INTO IdentityTest1
               values (@NewName)
          INSERT INTO IdentityTest2 (TestName)
               values (@NewName)
           INSERT INTO IdentityTest3 (TestName)
               values (@NewName)
          set @Counter = @Counter + 1
    END


-- Check for fragmentation: from the physical stats database
SELECT OBJECT_NAME([OBJECT_ID])  AS TableName,
       avg_fragmentation_in_percent AS Fragmentation,
       fragment_count, page_count
       FROM sys.dm_db_index_physical_stats
            (DB_ID(), null, null, null, null)

-- Results:
-- IdentityTest1  (using int identity) has a fragmentation %
-- of .44  and utilizes 4,695 data pages

-- IdentityTest2  (using a GUID with NEWID) has a
-- fragmentation %  of 99.24 and utilizes
-- 8,881 data pages!!!!  Ouch!!!!

-- IdentityTest3  (using a GUID with
-- NEWSEQUENTIALID) has a  fragmentation %  of .75
--  and utilizes 6,212 data pages
Listing 6: Ranking and multiple aggregations
use AdventureWorks2008r2
go
;WITH POCTE as
     ( select ProductID, SUM(LineTotal) as POTotal
      from  Purchasing.PurchaseOrderDetail POD
      join Purchasing.PurchaseOrderHeader POH
         on POD.PurchaseOrderID   = POH.PurchaseOrderID
     where YEAR(OrderDate) = 2008
                                        group by ProductID)   ,
 SOCTE as
    (select PRoductID, SUM(LineTotal) as SOTotal
      from Sales.SalesOrderDetail SOD
    JOIN Sales.SalesOrderHeader SOH
     ON SOH.SalesOrderID = SOD.SalesOrderID
   where YEAR(OrderDate) = 2008
  group by ProductID)

select * from
 (select  Product.Name , POCTE.POTotal, SOCTE.SOTotal,
   dense_RANK() over ( order by POTotal DESC) AS PORank
   from Production.Product
   LEFT JOIN POCTE  on Product.ProductID = POCTE.ProductID
   LEFT JOIN SOCTE  on Product.ProductID = SOCTE.ProductID )temp
 where PORank <= 10
Listing 7: Dynamic SQL with PIVOT
use AdventureWorks2008r2
go

declare @ShipMethodIDList nvarchar(1000),
        @ShipMethodNameList nvarchar(1000),
        @SQLQuerySyntax nvarchar(4000)

set @ShipMethodIDList =
    stuff (  (  select distinct ',[' +
            cast(ShipMethodID as varchar(100))  + ']'
               from Purchasing.ShipMethod
                     for xml path('') ), 1, 1, '')

-- will create a variable with the value:
-- [1],[2],[3],[4],[5]

set @ShipMethodNameList =
      stuff (  (  select distinct ',[' +
           cast(ShipMethodID as varchar(100))  +
               '] as [' + Name + ']'
               from Purchasing.ShipMethod
                        for xml path('') ), 1, 1, '')

-- will create [1] as [XRQ - TRUCK GROUND],
-- [2] as [ZY - EXPRESS], etc

set @SQLQuerySyntax = ';WITH PivotCTE as (
SELECT Ven.Name as VendorName, ShipMethodID,
          SUM(TotalDue) as OrderDollars
           FROM Purchasing.PurchaseOrderHeader POH
            join Purchasing.Vendor  Ven
            on POH.VendorID = Ven.BusinessEntityID
             group by Ven.Name, ShipMethodID )'

set @SQLQuerySyntax = @SQLQuerySyntax + '
      SELECT   VendorName, ' + @ShipMethodNameList +
     ' FROM PivotCTE
       pivot ( SUM(OrderDollars) for ShipMethodID in ('
            + @ShipMethodIDList + ')) TEMPLIST'

EXEC sp_executesql @SQLQuerySyntax
Listing 8: Performing a WHERE with an OUTER JOIN
use AdventureWorks2008R2
go

-- doesn't work!  The WHERE clause negates the OUTER JOIN
select Vend.Name, SUM(TotalDue) as VendorTotal
   from  Purchasing.Vendor   as Vend
     left outer     join  Purchasing.PurchaseOrderHeader AS POH
               on Vend.BusinessEntityID = POH.VendorID
     where YEAR(OrderDate) = 2008
      group by Vend.Name
      order by VendorTotal desc

-- this works!  By localizing the criteria in the WHERE clause
select Vend.Name, SUM(TotalDue) as VendorTotal
   from  Purchasing.Vendor   as Vend
      left outer     join  Purchasing.PurchaseOrderHeader AS POH
               on Vend.BusinessEntityID = POH.VendorID
                                    and YEAR(OrderDate) = 2008
      group by Vend.Name
      order by VendorTotal desc


-- This also works - as an alternative, the filtered/summarized
-- orders (by vendor) are placed into a common table expression
-- subquery

;WITH POTemp as
   ( SELECT VendorID, SUM(TotalDue) as VendorTotal
                FROM Purchasing.PurchaseOrderHeader
                WHERE YEAR(OrderDate) = 2008
                  GROUP BY VendorID)

select Vend.Name,  VendorTotal
   from  Purchasing.Vendor   as Vend
      left outer   join POTemp
               on Vend.BusinessEntityID = POTemp.VendorID
      order by VendorTotal desc
Listing 9: Manually setting an identity column
CREATE TABLE [dbo].[CostCenterMaster] (
   [CostCenterID] [int] IDENTITY(1,1) NOT NULL PRIMARY KEY ,
     [CostCenterName] [varchar](50) NOT NULL)
GO

insert into CostCenterMaster values  ('Cost Center A'),
                                    ('Cost Center B')

set identity_insert CostCenterMaster ON

insert into CostCenterMaster
          (CostCenterID, CostCenterName) values
          (-999, 'Unclassified')

select * from CostCenterMaster
set identity_insert CostCenterMaster OFF
Listing 10: Performing a rollback on a TRUNCATE
create table TruncateTest   (name varchar(100))
insert into TruncateTest values ('Kevin Goff')

begin transaction
    truncate table TruncateTest
           select * from TruncateTest   -- verify it's empty
rollback transaction

-- most people assume it's still empty
select * from TruncateTest  -- contains the original row!

   --what was rolled back was the allocation of space
Listing 11: Creating a Date Dimension
CREATE TABLE dbo.DimDateList  ( DatePK int PRIMARY KEY,
        ActualDate Date,  DayOfWeekName varchar(10),
        DayOfWeekNumber int,
        WeekEndDate Date, MonthDescr varchar(20),
       QuarterDescr varchar(20), Year int, MonthKey varchar(10),
        QuarterKey varchar(10), ShortWeekEnd varchar(12),
        ShortActualDate varchar(12))
GO

set nocount on

declare @startDate DateTime, @EndDate datetime
set @StartDate = '1-1-2011'
set @EndDate =   '12-31-2011'

declare @MidWeek datetime, @DatePK int, @ActualDate Date,
        @DayOfWeekName varchar(10), @DayOfWeekNumber int,
        @WeekEndDate Date, @MonthDescr varchar(20),
        @QuarterDescr varchar(20), @Year int,
        @MonthKey varchar(10), @QuarterKey varchar(10),
        @ShortWeekEnd varchar(12), @ShortActualDate varchar(12

while @StartDate <= @EndDate
    begin
          -- Suppose the @StartDate (current date in the loop) is
          -- Friday, 4/1/2011

        -- the Wednesday day (mid-week) was March 30th, which was
         -- back in April

          set @MidWeek = @StartDate +(4 - datepart(dw,@startdate))

         -- the DatePK is 20110401
         set @DatePK = cast(year(@StartDate) as varchar(4)) +
                       right( '0' + cast(month(@StartDate)
                        as varchar(2)),2) +
                        right('0' + cast(Day(@StartDate)
                       as varchar(2)),2)

          -- the ActualDate is 04/01/2011
         set @ActualDate = @startDate

         -- the DayOfWeekName is Friday
         set @DayOfWeekName = DATENAME(DW, @StartDate)

         -- the DayOfWeekNumber is 6 (sixth day of the week)
         set @DayOfWeekNumber = DATEPART(DW,@StartDate)

         -- the WeekendDate (Saturday) is 4/2/2011  (assuming a
         -- Sunday to Saturday business week)
         set @WeekEndDate  = @StartDate +
                         (7 - datepart(dw,@StartDate))

         -- the MonthDescr is March 2011 (since the midweek was
         --back in March)
         set @MonthDescr =  datename(m,@MidWeek) + ' ' +
                        cast(year(@MidWeek) as varchar(4))

         -- the QuarterDescr is Q1 2011 (since the midweek was
         --still back in March)
         set @QuarterDescr =   'Q' + cast(datepart(qq,@MidWeek)
                          as varchar(1))  + ' ' +
                          cast(year(@MidWeek) as varchar(4))

         -- the Year is 2011
         set @Year = Year(@MidWeek)

         -- the MonthKey (used for sorting) is 2011-03
         set @MonthKey = cast(year(@MidWeek) as varchar(4))+ '-' +
                    RIGHT('0' +  cast(datepart(m,@MidWeek)
                         as varchar(2)),2)

         -- the QuarterKey (used for sorting) is 2011-1
         set @QuarterKey =    cast(year(@MidWeek) as varchar(4)) +
                   '-' + cast(datepart(qq,@MidWeek) as varchar(1))


         -- the Week End Date description is Apr 02, 2011
         set @ShortWeekEnd = CONVERT(varchar(12),@WeekEndDate,107)

         -- the Actual Date description is Apr 01, 2011
        set @ShortActualDate = CONVERT(varchar(12),@ActualDate,107)

        insert into DimDateList
              (DatePK,ActualDate, DayOfWeekName , DayOfWeekNumber ,
               WeekEndDate, MonthDescr, QuarterDescr, Year,
              MonthKey, QuarterKey, ShortWeekEnd, ShortActualDate)
         Values
             (@DatePK,@ActualDate,@DayOfWeekName,@DayOfWeekNumber,
              @WeekEndDate, @MonthDescr, @QuarterDescr, @Year,
             @MonthKey,@QuarterKey,@ShortWeekEnd, @ShortActualDate)
       set @StartDate = @StartDate + 1
    end
Listing 12: Using of GROUPING SETS to produce total row
SELECT CASE WHEN GROUPING(SM.Name)=1 THEN 'Total'
               else SM.Name End
             as ShipName,
        CASE WHEN GROUPING(Year(OrderDate))=1 THEN 'Total'
               else CAST(YEAR(OrderDate) AS VARCHAR(4)) end
             as OrderYear,

   SUM(Freight) as TotFreight, SUM(TotalDue) as TotalDue
   FROM Purchasing.ShipMethod  SM
     JOIN Purchasing.PurchaseOrderHeader POH
                 ON SM.ShipMethodID = POH.ShipMethodID
     GROUP BY GROUPING SETS (
                    (SM.Name, YEAR(OrderDate)),
                     ())